
How to Choose the Right Uptime Monitoring Tool for Your Startup (Without Overpaying or Overbuilding)
UK startup guide to choosing an uptime monitoring tool: compare website monitoring, monitor types, alerting speed and affordable monitoring that scales
A practical UK buyer’s guide to uptime monitoring and website monitoring for early-stage startups — covering monitor types, alerting speed, setup time, and pricing that scales with you, not against you.
The right uptime monitoring tool for a startup checks three boxes: it covers the monitor types you actually need (not just basic HTTP pings), it alerts you quickly without crying wolf, and its pricing grows with you instead of punishing you for growing. For a typical five-person SaaS startup, that usually translates into an entry-level plan with around 15–20 monitors, HTTP/S plus SSL plus at least one heartbeat check, and alerts routed to Slack or a webhook rather than email alone.
A handful of tools are worth evaluating against that framework — Moonitor, UptimeRobot, Better Stack, and Pingdom all take slightly different approaches to multi-region verification, alerting, and pricing. Rather than picking a winner for you, I want to walk through how to compare them properly, because the honest answer is “it depends on your stack and your growth stage” more than it’s any single product name.
If you’ve spent any time comparing uptime monitoring tools, you already know the paradox: there are dozens of options, and somehow none of them feel like they’re built for a five-person startup with a limited budget and limited patience for complicated setup. Let’s work through what actually matters and what you can safely deprioritise.
Why Startups Need Uptime Monitoring From Day One
Here’s a scenario I hear constantly: a founder is asleep at 2am when their API starts throwing errors. Nobody notices until a customer emails support the next morning, cc’ing three other people, asking why the app has been broken since last night. That’s not a hypothetical — it’s how a lot of startups discover they needed monitoring in the first place.
It’s worth being precise about what “uptime monitoring” covers, since the term gets used loosely. At its core, it’s checking whether a service responds correctly at regular intervals — synthetic checks that simulate a visitor or API call on a schedule and flag it when the response doesn’t look right. That’s different from performance monitoring (how fast something responds) or error-rate monitoring (how often requests fail once they arrive). If you only need to know “is it up,” uptime monitoring is the right category; if you also need to know “why is it slow” or “which line of code threw this exception,” you’ll eventually want performance monitoring or error tracking alongside it, not instead of it.
The real cost of downtime isn’t just lost revenue during the outage. It’s the trust hit. Pre-Series A, you don’t have the brand equity to absorb “oh, that happens sometimes.” Every customer feels disproportionately important because, frankly, they are — losing one can sting for months. Industry estimates on the cost of downtime vary widely and mostly reflect larger enterprises, so treat any big headline number with scepticism; for an early-stage startup, the bigger risk is usually reputational, not a specific pound figure.
If you’re deciding what to monitor first, here’s a reasonable starting order:
- Your homepage or main marketing site (HTTP/S)
- Your primary API endpoint or login flow (HTTP/S or keyword)
- Your SSL certificate and domain expiry
- Any scheduled job your business actually depends on — billing runs, data syncs, backups
That last one trips up more startups than people expect. I’ve seen a nightly billing-sync cron job silently stop running after a deploy changed a file path — nobody noticed for eleven days, until finance flagged a revenue mismatch. A basic heartbeat monitor would have caught it on day one.
The good news is that the excuse to wait holds up less well than it used to. Setting up a first basic check on most modern monitoring tools takes a few minutes rather than an afternoon. Full coverage across your stack takes a bit longer — more on that below — but there’s less reason than ever to keep the whole thing on the back burner. ☕
What Features Should a Startup Prioritise in an Uptime Monitoring Tool?
Most people start their search for an uptime monitoring tool by typing “is my website up” into Google, which is a fine starting point but a poor finishing one. Basic HTTP checks tell you if a page loads. They don’t reliably tell you if:
- Your SSL certificate is about to expire, which can break checkout for visitors on certain browsers
- A cron job silently stopped running because a deploy changed a file path
- Your DNS records were altered without anyone noticing
- A specific API endpoint is returning 200 OK but the response body is missing data your app depends on
A well-rounded uptime monitoring tool should offer several distinct check types. Note that “port/ping” is actually two different things worth separating: ICMP ping tells you if a host responds at the network level at all, while a TCP port check confirms a specific service (say, your database port) is accepting connections. Neither tells you whether the application behind that port is actually working correctly, which is what HTTP and keyword checks are for.
Uptime Monitor Types to Compare
| Monitor type | What it catches | Typical priority |
|---|---|---|
| HTTP/S | Page or endpoint not loading, wrong status code | Baseline for any live site or app |
| Keyword | Page loads but expected content/text is missing | High if you have checkout or login |
| TCP port check | Specific service unreachable (e.g. database, mail server) | High if you manage your own servers |
| ICMP ping | Host completely unreachable at the network level | Useful for self-hosted infrastructure |
| SSL / domain expiry | Certificate or domain about to lapse | High — cheap to add, expensive to skip |
| Cron / heartbeat | Scheduled job silently failed or stopped running | High if you rely on background jobs |
| DNS record change | Records altered or hijacked without notice | Worth adding once you’re customer-facing |
Here’s a rough, dated snapshot of how a few well-known tools compare on the basics (checked early 2025 — pricing pages and feature lists change often, so verify directly before deciding):
| Tool | Monitor types offered | Multi-region checks | Alert channels | No-card free trial |
|---|---|---|---|---|
| Moonitor | HTTP/S, keyword, port, SSL, cron/heartbeat, DNS | Yes, cross-region agreement before alerting | Slack, Teams, Telegram, webhook, email | Check current site |
| UptimeRobot | HTTP/S, keyword, port, ping, SSL, cron | Yes on paid plans | Slack, webhook, email, SMS (paid) | Yes, free tier available |
| Better Stack | HTTP/S, keyword, port, SSL, heartbeat, incident management | Yes | Slack, Teams, phone call, webhook | Yes |
| Pingdom | HTTP/S, port, transaction checks | Yes | Slack, webhook, email, SMS | Trial, card required |
Treat this table as a starting shortlist, not a verdict — feature sets and free-tier limits shift regularly, and the right pick depends on which monitor types your stack actually needs.
How Important Is Alerting Speed and Reliability?
Alerting is the second half of the equation, and there’s more nuance than “does it send a notification”. When comparing tools, look specifically at:
- Notification delay — how long between a failed check and an alert reaching you
- Retry and escalation logic — does one failed check page you at 2am, or does it retry first and escalate to a second person if unacknowledged?
- Maintenance windows — can you silence alerts during planned deploys?
- Deduplication — does one outage generate one alert, or twenty?
- Webhook/API support — can you pipe alerts into a system you’ve already built?
Email alerts are fine as a fallback, but they’re rarely fast enough as a primary channel. If your team lives in Slack or Microsoft Teams, that’s where you want the ping; fast-moving teams may also want Telegram or raw webhooks. Confirm which of these a specific tool actually supports before assuming it covers your workflow — and then there’s pricing structure, which we’ll dig into below.
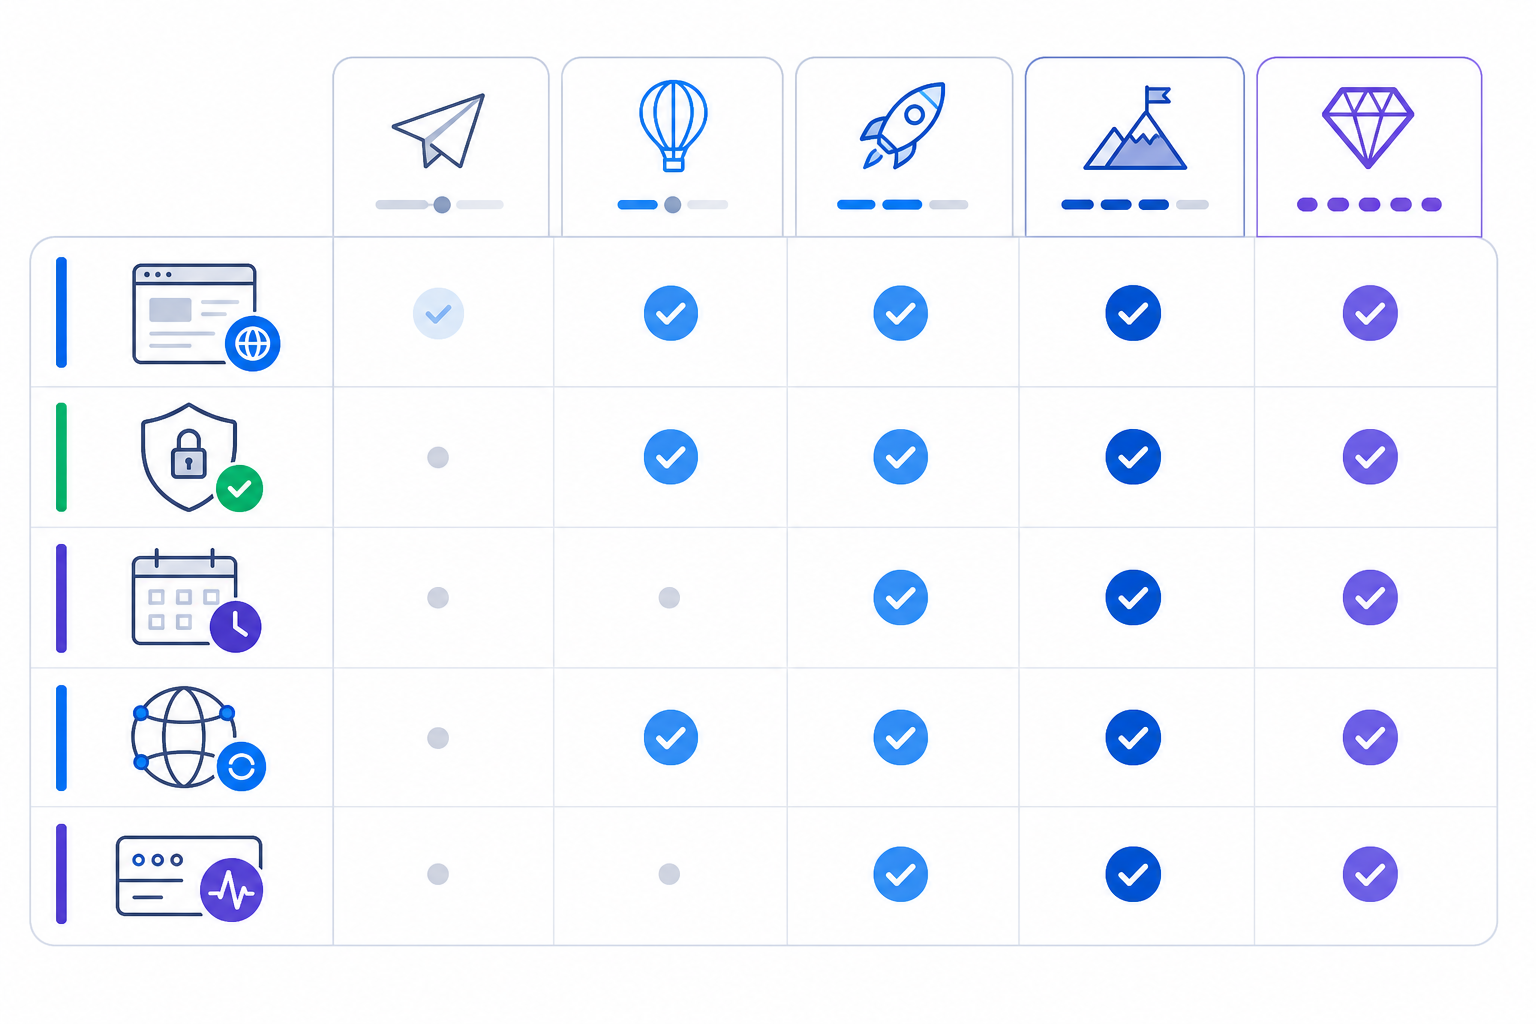
Minimum Viable Monitoring Stack for a Five-Person Startup
Since the whole point of this guide is avoiding both overpaying and overbuilding, here’s a concrete starting point rather than a vague principle. For a typical early-stage SaaS startup, your baseline website monitoring and uptime monitoring stack looks something like this:
- HTTP/S check on your production homepage — catches the most visible failures
- HTTP/S or keyword check on your core login/API endpoint — catches the failure that actually costs you customers
- Keyword check on your critical customer workflow (checkout, signup, or whatever generates revenue)
- SSL/domain expiry check — cheap, easy, and prevents an entirely avoidable outage
- One heartbeat/cron monitor on your most business-critical scheduled job (billing, backups, data sync)
That’s five monitors, which fits comfortably inside most entry-level paid tiers. Everything below is worth adding once a specific trigger hits — not before:
- Staging environment monitoring — once staging and production are meaningfully different and staging outages waste engineering time
- DNS record change monitoring — once you’re customer-facing and a hijacked record would be a real incident, not just an inconvenience
- Port/ping checks on self-managed servers — once you’re running your own infrastructure rather than a managed platform
- A public status page — once support tickets asking “is it down?” start arriving more than once a month
How Multi-Region Monitoring Reduces False Alarms
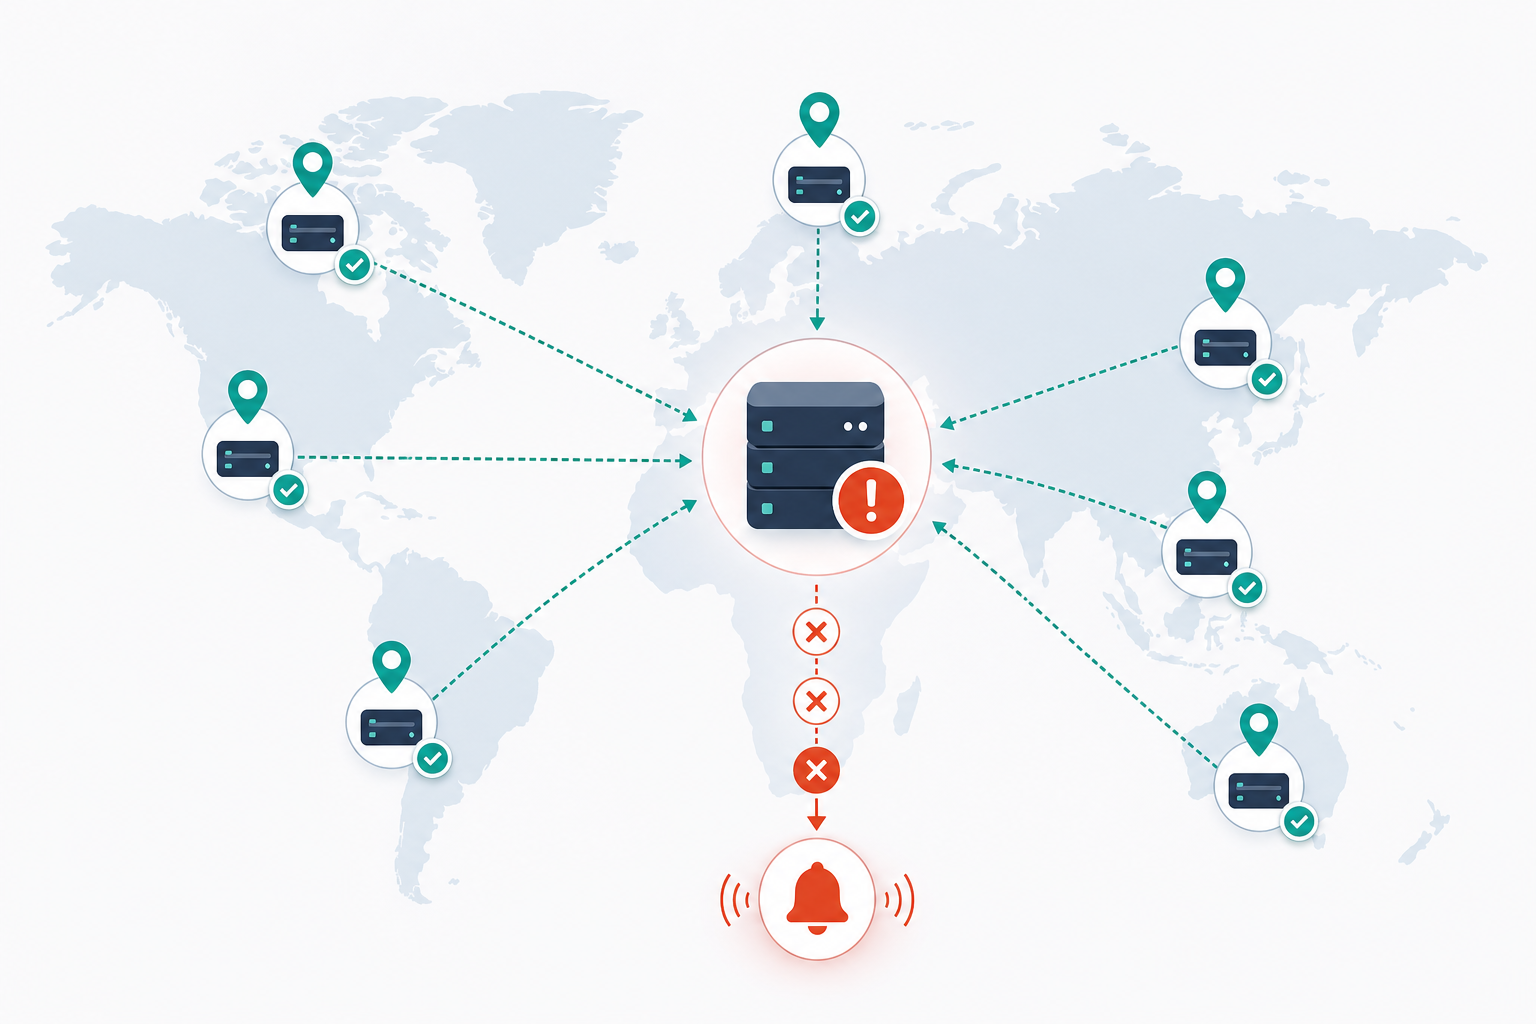
Let me tell you about the classic false alarm, because if you’ve used monitoring tools before, you’ve probably lived it. Your monitoring service checks your site from a single location. That location has a brief network blip — nothing to do with your actual server. The tool doesn’t know that, though. It just sees a failed request and fires off an alert. Your team scrambles, checks logs, finds nothing wrong, and eventually realises it was a false positive.
The problem isn’t just the wasted ten minutes. It’s what happens after the third or fourth false alarm: people start ignoring the alerts. That’s alert fatigue, and it quietly defeats the entire purpose of having monitoring in the first place. If your team has learned to shrug off pings from your monitoring tool, you don’t actually have monitoring — you have background noise.
Multi-region verification helps here, though the mechanics vary more between vendors than most comparison articles admit. Instead of trusting a single check location, a good monitoring system waits for agreement from multiple regions before it alerts you — sometimes called a quorum. But “multi-region” isn’t one standard implementation: vendors differ in how many regions they use, how many need to agree before alerting, how long they wait between retries, and what timeout counts as a failure. Some of that variation is genuinely important — a tool that requires agreement from 3 of 5 regions behaves differently than one requiring just 2 of 3, and a tool with a longer retry window will alert you slightly later but with more confidence.
That’s the real trade-off: more regional agreement generally means fewer false positives, but it can also mean a few extra seconds or minutes before you’re alerted to a genuine outage. For most startups, that trade-off is worth it — a two-minute delay on a real incident matters far less than a team that’s learned to ignore every third alert.
Moonitor, for example, describes running checks from multiple regions and waiting for cross-region agreement before alerting, according to its documentation as of early 2025 — the exact region count and quorum threshold are worth confirming directly, since these details change as products iterate. Rather than taking any vendor’s claim at face value, ask during a trial: can you simulate a single-region failure and see whether it triggers a false alert? That’s a more reliable test than reading a features page.
Setup Speed: Why It Matters for Lean Teams
Startups don’t usually have a dedicated ops person whose whole job is fiddling with monitoring dashboards. Whoever sets this up is probably also shipping code, answering support tickets, and trying to close a deal before lunch. Setup speed isn’t a nice-to-have feature — it’s a real factor in whether monitoring gets done at all.
Here’s the honest truth: if a tool takes real effort to configure each monitor, most teams will set up exactly one check — the homepage — and call it a day. That leaves your API, your backend server, your nightly cron jobs, and your SSL certificate unmonitored. Those are usually the things that fail first.
A realistic setup sequence for the minimum viable stack above looks like this:
- Homepage HTTP/S check — paste the URL, set a 1–5 minute interval. Dashboard-only, under a minute.
- API/login endpoint check — same as above, plus setting an expected status code. Dashboard-only, a couple of minutes.
- Keyword check on checkout/signup — add the expected text string to match against. Dashboard-only, a couple of minutes.
- SSL/domain expiry check — usually just requires the domain name. Dashboard-only, under a minute.
- Heartbeat/cron monitor — requires a small code change so your job pings the monitor’s URL on completion, plus a deploy. This is the one that takes real time — budget 15–30 minutes including testing.
All told, budget a working session of 30–60 minutes to get this baseline stack properly configured, most of which is the cron step. That’s still a fraction of what manual, DIY monitoring setups used to require.
A good gut check when evaluating any tool: if the onboarding flow needs a tutorial video before you can add your first HTTP monitor, it’s probably not built with small teams in mind.
How Uptime Monitoring Pricing Scales With Your Startup
Pricing is where a lot of otherwise-good monitoring tools quietly become a bad deal. Free tiers are genuinely useful for testing the waters, but watch for aggressive monitor caps or slow check intervals — a free plan that only checks every 30 minutes isn’t going to catch much.
For UK-based startups, most monitoring tools price primarily in US dollars, so your actual cost moves with the exchange rate and may not include VAT — always check the checkout page. The figures below were checked in early 2025 and should be treated as illustrative rather than current pricing; confirm directly before budgeting, and note whether a quoted price is billed monthly or discounted for annual billing.
| Plan tier | Approx. monthly price (billed monthly) | Monitors included | Typical check interval | Alert channels included |
|---|---|---|---|---|
| Free | £0 | Small handful | 5–30 min | Email only, typically |
| Entry paid | ~£10–15 (e.g. $14 on Moonitor’s Solo plan) | ~15–20 | 1 min | Email + Slack/webhook |
| Mid/unlimited | ~£35–50 (e.g. $49 on Moonitor’s Max plan) | Unlimited | Under 1 min | Full channel set + escalation |
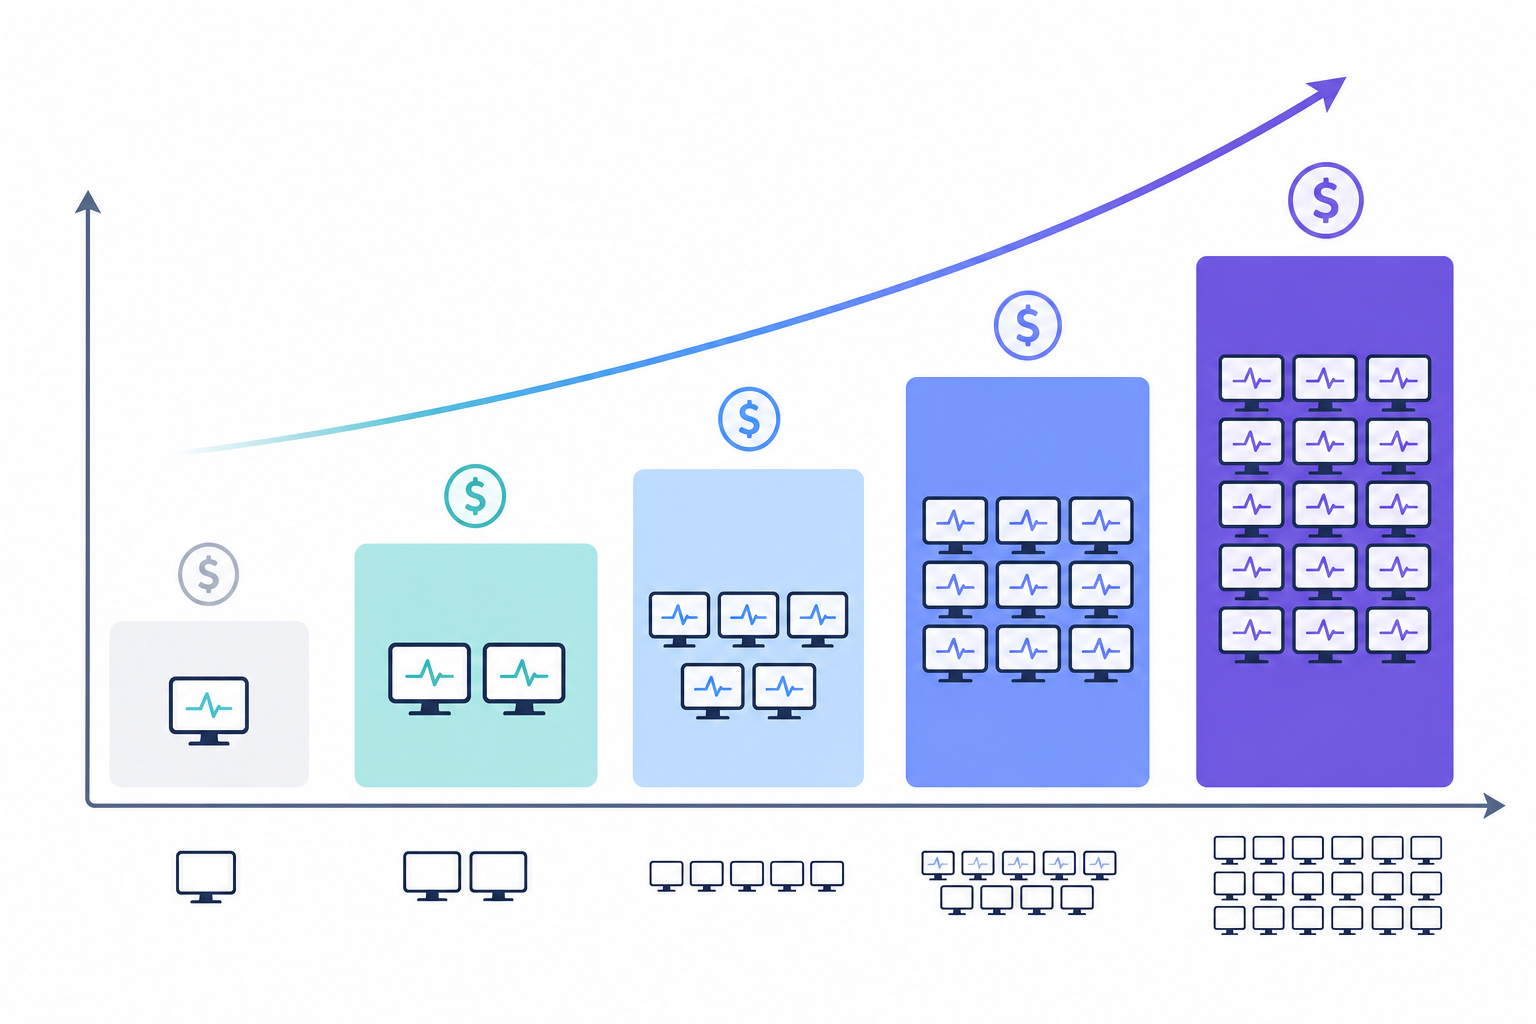
Annual billing typically knocks 15–20% off the monthly rate on most tools, which is worth factoring in once you’re confident you’ll stick with a vendor past the trial period. An entry-level paid plan covering around 15–20 monitors tends to be the sweet spot for an early-stage team — enough for the five-monitor baseline stack plus room to grow. As you add environments, servers, and scheduled jobs, you’ll likely want a mid-tier or unlimited plan, which matters once you’re tracking staging and production separately.
A few things worth checking before you commit:
- Is there a free trial, and does it require a credit card? A no-card trial removes friction and lets you test check accuracy before paying, though it’s not proof of quality on its own — read a few independent reviews too.
- Does pricing scale with monitors, checks, or seats? Per-monitor pricing is predictable as you add services. Per-check pricing can rise if you increase check frequency. Per-seat pricing charges you for growing your team.
- Is there a reasonable middle tier? Watch for pricing pages that jump from a tiny free plan straight to an expensive enterprise tier.
- Does billing clarify VAT and currency for UK customers? If it doesn’t, ask before you commit.
Red Flags to Avoid When Choosing an Uptime Monitoring Tool
After looking at enough monitoring tools, certain patterns start jumping out as warning signs. Some are dealbreakers from day one; others become more important as you scale.
Fix before you sign up, regardless of stage:
- Vendor lock-in. No API access and no way to export your incident history or response-time data if you ever switch tools. You should always own your own data.
- Email-only alerting. No Slack, Teams, Discord, Telegram, or webhook support means alerts land somewhere your team isn’t actively watching.
- Opaque, jumpy pricing. Tiers that leap from £10 to £200 with nothing in between aren’t built for a growing startup.
- No published status page or uptime commitment for the monitoring tool itself. If the tool responsible for catching your outages has no visibility into its own reliability, that’s a red flag worth taking seriously — ask what happens if its checking infrastructure goes down.
Worth watching as you grow, but not always urgent on day one:
- Basic HTTP monitoring only, with no path to add SSL, cron, or DNS checks later. Fine for a very early landing page; a problem once you have real infrastructure.
- No public status page option for your own product. Not essential for a five-person team with no customers yet, but once you have real users, a status page answers “is it just me, or is the app down?” before it becomes five separate support tickets.
- No incident history or response-time analytics. Without historical data, you can’t spot patterns — like an API that reliably slows down during a Monday morning traffic spike.
- Slow or unresponsive support during your trial. If a vendor is slow to answer questions before you’re a paying customer, that’s a preview of what happens after an outage.
Uptime Monitoring Tool Checklist: Questions to Ask Before You Sign Up
Before you commit to any uptime monitoring tool, run through this checklist. Score each answer 0 (poor/absent), 1 (adequate/present but limited), or 2 (strong/fully covers your need), using the guidance below, then add up your total out of 14.
- Does it support the monitor types I need now and in six months? (0 = HTTP only; 1 = HTTP + SSL; 2 = HTTP, SSL, and cron/heartbeat at minimum) — non-negotiable: score at least 1 here.
- How does it verify an outage before alerting me? (0 = single-region only; 1 = multi-region but unclear quorum; 2 = multi-region with documented, testable quorum logic) — non-negotiable: score at least 1 here.
- Which alert channels are included, and do they match where your team communicates? (0 = email only; 1 = one extra channel like Slack; 2 = multiple channels plus webhook/API) — non-negotiable: score at least 1 here.
- What happens to my pricing and monitor count as I grow past the entry tier? (0 = steep unexplained jumps; 1 = predictable but pricey; 2 = clear, fair scaling with VAT/currency clarity for UK billing)
- Can I export my data or use an API if I need to migrate later? (0 = no access; 1 = partial export; 2 = full API access and export)
- Is there a free trial, and does it require a credit card upfront? (0 = no trial; 1 = trial requires card; 2 = no-card trial)
- How long does it realistically take to get my first five monitors running? (0 = over an hour with a steep learning curve; 1 = 30–60 minutes; 2 = a few minutes for basics, under an hour for the full baseline stack)
Score bands: 0–5 is a poor fit — keep looking. 6–9 is workable but has real gaps worth negotiating around. 10–14 is a solid fit. But treat questions 1, 2, and 3 as non-negotiable regardless of total score — a tool that scores 12 overall but fails on alert channels isn’t actually going to work for a fast-moving team.
FAQ: Choosing an Affordable Uptime Monitoring Tool
What features should a startup prioritise in an uptime monitor?
Start with coverage that matches your actual stack: HTTP/S is the baseline, and SSL/domain expiry plus cron/heartbeat monitoring cover two of the most common startup failure points that basic checks miss entirely. From there, prioritise alerting reliability over raw speed — a tool that pings you fast but wrongly slowly trains your team to ignore it. Pricing that scales without punishing growth, and clarity on currency/VAT for UK buyers, rounds out the list.
How much should I expect to pay for uptime monitoring?
As a rough, dated guide (checked early 2025), entry-level paid plans for a small startup tend to sit around £10–15 per month for roughly 15–20 monitors, moving up to £35–50 per month for unlimited monitors as you add APIs, servers, and scheduled jobs. Many tools price in US dollars, so factor in exchange rate movement and check whether VAT is added at checkout, and whether annual billing offers a meaningful discount. Free tiers exist but usually cap monitor count or check frequency.
Do I need multiple monitor types or just HTTP checks?
If you’re running more than a simple marketing site, yes. HTTP checks alone won’t catch an expiring SSL certificate, a silently failing cron job, or a DNS record that’s been altered. You don’t need every monitor type on day one — the five-monitor baseline stack above covers most early needs — but you’ll want a tool that offers the rest before you need them urgently.
How fast can I get website monitoring set up?
For a basic HTTP or keyword check, pasting a URL and setting an interval takes a minute or two on well-designed modern tools. Cron/heartbeat checks take longer since they need a small code change and a deploy. Budget a working session of 30–60 minutes for a small startup’s first proper five-monitor setup.
Is uptime monitoring the same as performance monitoring or error tracking?
No, and this trips people up when shopping for tools. Uptime monitoring answers “is it responding correctly right now?” Performance monitoring answers “how fast is it responding, and where’s the bottleneck?” Error tracking answers “which specific request or line of code failed, and how often?” Most startups need uptime monitoring first because it’s the cheapest, fastest way to know something’s broken at all — but as you scale, you’ll likely add a performance or error-tracking tool alongside it, not instead of it.
How often should checks actually run?
For most customer-facing pages and APIs, a check interval of one to five minutes is a reasonable default — frequent enough to catch problems early without generating excessive volume on a per-check pricing plan. Less critical internal endpoints can run on longer intervals. If a free or entry plan only checks every 30 minutes, treat that as a real limitation.
Your Next Steps: Choosing the Right Monitoring Tool
Choosing an uptime monitoring tool doesn’t need to be a week-long research project. Here’s a concrete three-step plan: first, configure the five-monitor baseline stack above — homepage, core API/login, critical workflow, SSL expiry, and one heartbeat — on whichever tool you’re trialling. Second, run a controlled test: intentionally break something (or simulate a single-region failure) and time how long it takes for a real alert to reach the right person in the right channel. Third, before you pay for anything beyond the free tier, map your pricing against where you expect to be in six months — more environments, more APIs, maybe a second engineer — and check whether the plan you’re about to choose still makes sense then, VAT and currency included.
Get that right, and you’ll spend a lot less time worrying about 2am surprises, and a lot more time building the thing you actually set out to build.