
5 Signs Your Current Monitoring Setup Isn't Good Enough (And How to Fix It)
Not sure if your monitoring setup is actually protecting your business? Here are 5 warning signs your uptime monitoring has gaps—plus how to fix them
5 Signs Your Monitoring Setup Isn't Good Enough (And How to Fix It This Afternoon)
Meta description: Five clear signs your monitoring setup has blind spots, from false alerts to missing SSL and DNS checks, plus a practical afternoon plan to fix each one.
If customers are telling you about outages before your tools do, if you're drowning in false alerts, or if you have zero visibility into SSL and DNS issues, your monitoring setup has real gaps. I know that's not fun to hear, especially if you spent a weekend cobbling together a DIY setup with a free ping tool and a cron job. But here's the good news: none of this requires a massive infrastructure overhaul. Most of it is fixable in an afternoon, once you know what to check and how to configure it.
I've talked to a lot of founders and developers, including several running UK-based SaaS products and e-commerce sites, who thought their monitoring was "good enough" until it wasn't. By the end of this post, you should be able to look at your own setup, spot the gaps, and know exactly what to do about each one.
Quick self-check. Before we dig in, ask yourself:
- Have you ever found out about downtime from a customer before your alerts fired?
- Do you get alerts that turn out to be false more than, say, once a week?
- Do you know your SSL certificate's expiry date right now, without checking?
- Would your team actually trust an alert if it came in at 3am?
- If your site went down, could customers find out what's happening without emailing you?
If you hesitated on two or more of those, keep reading. Let's walk through the five signs properly.
Sign 1: Your Monitoring Setup Only Checks the Homepage
You know this scenario. A customer emails asking why the checkout page won't load. You check, and it's been down for twenty minutes — twenty minutes you had no idea about until someone else told you.
This is a coverage problem, not just an alerting problem. Most DIY monitoring setups only check whether the homepage returns a 200 status. That tells you almost nothing about whether checkout works, whether login succeeds, or whether your API is returning valid data rather than a generic error page that happens to load fine.
The fix starts with mapping your critical user journeys, not just your homepage. As a starting point, I'd check:
- Homepage and key marketing pages every 5 minutes
- Checkout, login, and any payment-related endpoints every 1–3 minutes
- API health endpoints, ideally an authenticated one rather than just a public ping, every 1–5 minutes
- Background jobs and cron tasks via heartbeat monitoring, so a job that silently stops running actually gets flagged
These are starting points, not rules carved in stone. A high-traffic checkout flow probably needs tighter intervals than a static content page does. The real question isn't "is the homepage up?" It's "is the business actually working?" Most monitoring gaps live in the space between those two questions.
Sign 2: You're Drowning in False Positives and Alert Fatigue
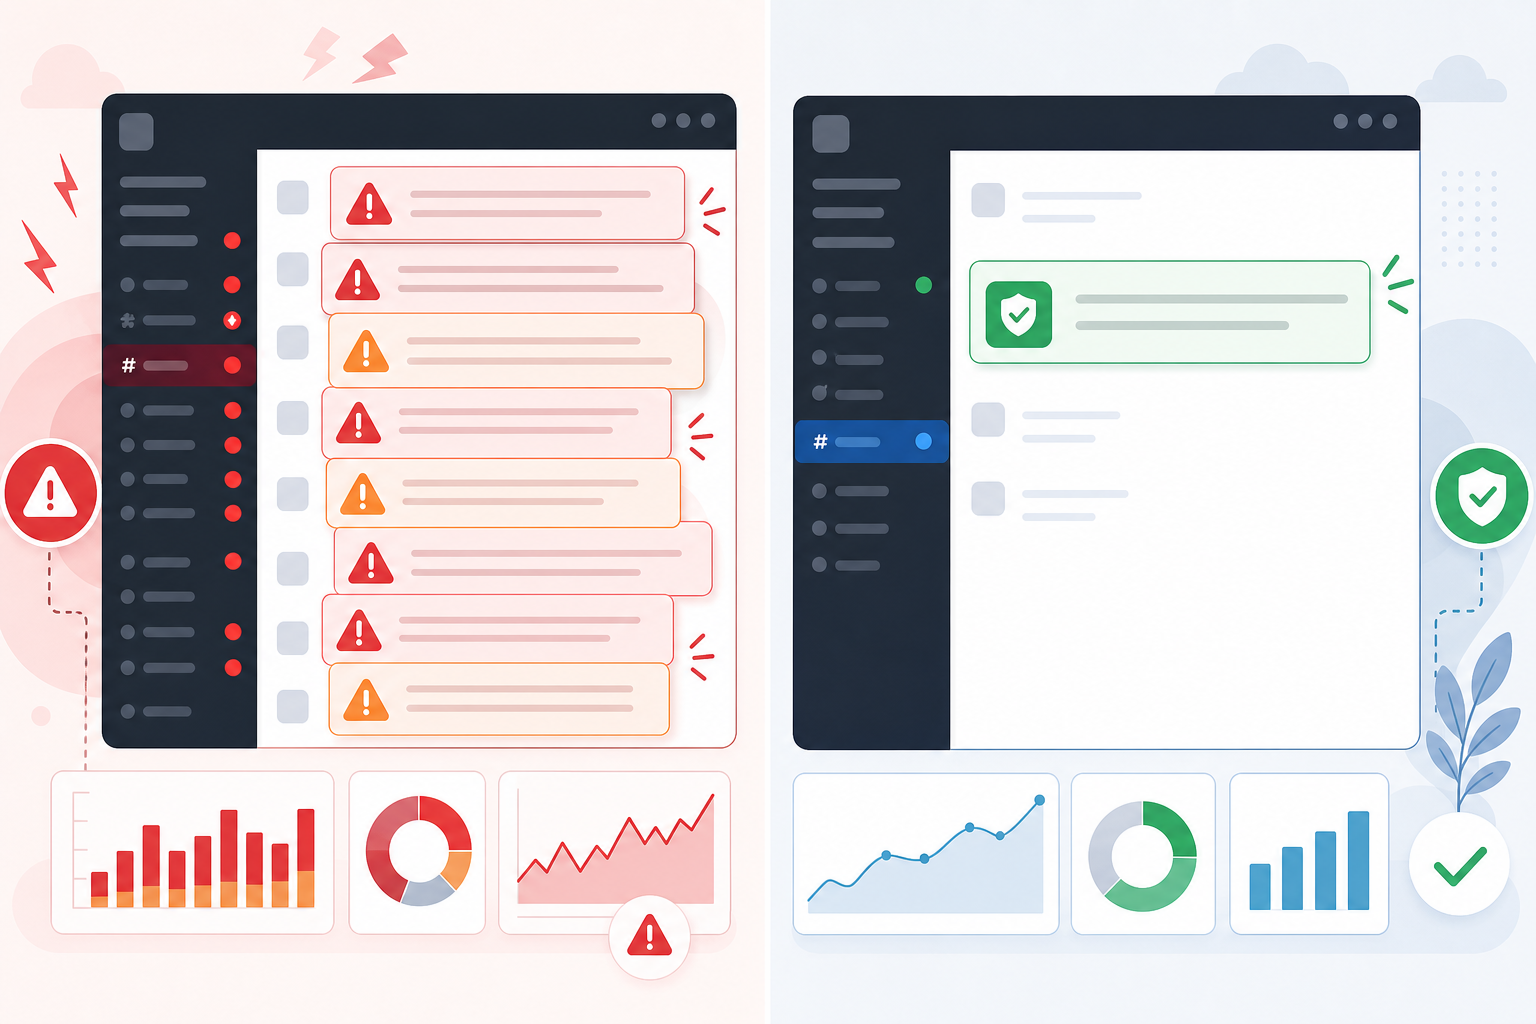
Alert fatigue creeps up on you. It starts with one 3am Slack ping about a "down" server that turns out fine two minutes later. Then it's three a week. Then it's daily. Pretty soon, nobody on the team even opens the alerts channel, because most of what lands there is noise.
Sign 1 is about whether you're checking the right things. Sign 2 is about whether you trust what happens when a check fails. A few usual suspects behind noisy alerts:
- Single-location checks that mistake a local network blip for a full outage
- No retry logic, so one failed request equals one alert, even if the very next request succeeds fine
- No confirmation window, meaning a monitor fires instantly instead of waiting for a second or third failed attempt
- Overly sensitive latency thresholds that treat a slightly slow response the same as a total outage
- No maintenance windows, so planned deployments trigger alerts nobody needed
A sensible baseline: require at least two consecutive failed checks, ideally confirmed from more than one region, before an alert fires. Set separate thresholds for "warning" — say, response time doubling — and "critical," like a genuine timeout or error. Multi-region confirmation plus retry logic will cut down false positives a lot, but they won't catch everything, especially bugs that live in your application code rather than the network. It's a big improvement. Not a silver bullet.
Sign 3: You Have No Visibility Into SSL Certificate or DNS Issues
Here's a scenario that catches even experienced teams off guard: your site runs perfectly fine for months, then one morning it's completely inaccessible. Not because your server crashed. Because your SSL certificate quietly expired overnight, and browsers are now throwing security warnings at every visitor.
SSL certificates don't send a polite reminder before they expire. A reasonable alerting schedule is 30, 14, and 7 days out, so you have real time to renew instead of scrambling on the day it lapses.
DNS issues are just as sneaky, sometimes worse. A record change — whether it's a typo during a config update or something more concerning — can go unnoticed for days if nothing's watching. Your homepage might load fine while your API subdomain, or your MX records handling email delivery, silently point somewhere they shouldn't.
Monitoring DNS properly means two separate things: checking that resolution works at all, and checking that your key A, CNAME, and MX records haven't changed unexpectedly. Those solve different problems, and most homegrown setups do neither.
Sign 4: Your Team Doesn't Trust the Alerts
This one is subtle, but it might be the most telling sign on this list. Sign 2 is about whether alerts are accurate. Sign 4 is about whether an alert, even an accurate one, actually helps anyone respond. If your engineers have muted the monitoring channel, or the running joke is "just ignore that, it's probably nothing," your alerts have failed at their one job.
Here's a useful test: could someone on your team act on this alert without asking a follow-up question first? A good alert includes the monitor name, the affected URL, the timestamp, which region or regions detected the failure, the HTTP status or error returned, current response time versus the usual baseline, and ideally a link to a runbook or previous incident notes.
An alert that just says "something's wrong" forces someone to go digging before they can even start fixing anything. That's exactly when trust starts to erode.
Once trust is gone, it's genuinely hard to get back, because everyone's default response becomes scepticism instead of action. If your team has quietly stopped reacting to alerts, that's not a small annoyance. That's the whole monitoring system failing, just quietly.
Sign 5: You Can't Show Customers a Status Page
Even the best-monitored infrastructure goes down sometimes. That's not a failure — it's just how the internet works. What matters is what happens next. When something breaks and customers can't find any information, they don't stay patient. They start opening support tickets, all asking the same question: "Is this down for everyone, or just me?"
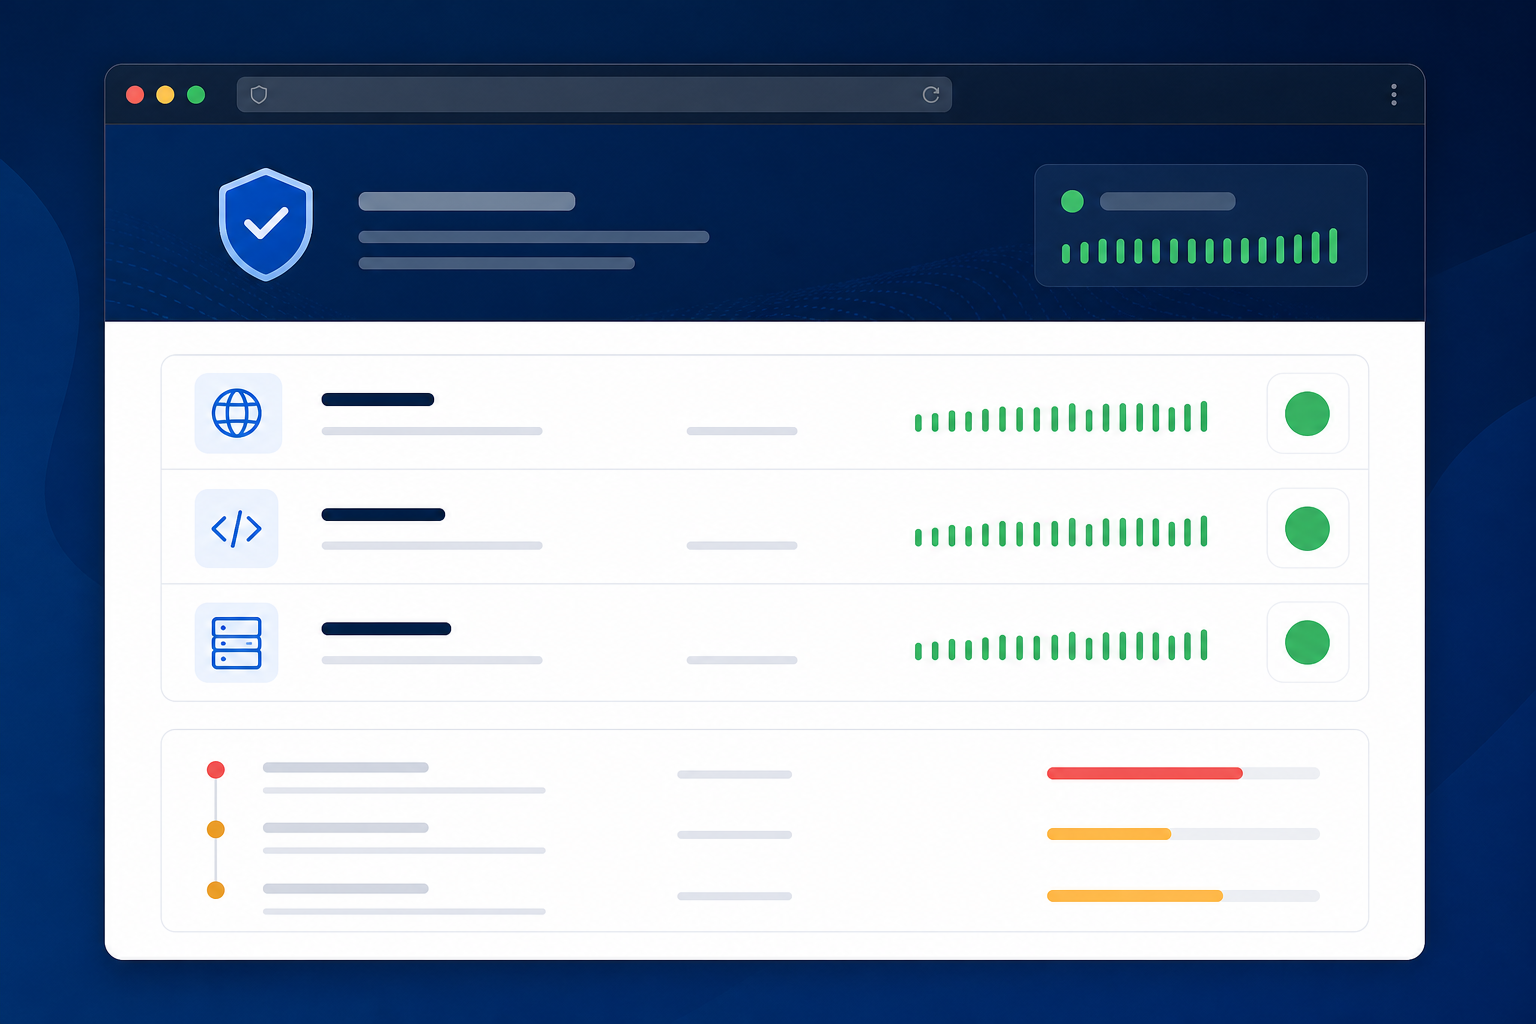
Without a public status page, you or your support team end up answering that question over and over, in real time, while also trying to fix the actual problem. A branded status page with component-level status — website, API, and any other services broken out separately — incident updates as they happen, and a visible incident history changes that dynamic. Customers can check it themselves and get updates without emailing anyone.
One caveat worth mentioning: a status page should communicate impact and progress, not expose sensitive infrastructure details like internal server names or specific vulnerability information. Honesty and clarity matter more than technical completeness here. Customers don't expect perfection. They just want to know what's going on.
How to Fix Your Monitoring Gaps This Afternoon
Rather than repeating each fix above, here's a rough order to work through if you're starting from scratch or patching an existing setup:
Audit what's actually covered right now (30 minutes). List every website, API, cron job, SSL certificate, and DNS zone you rely on, and mark what's currently monitored versus what isn't. Most teams find at least one gap the moment they do this honestly.
Pick your critical checks and set intervals (20 minutes). Prioritise checkout, login, and API health over marketing pages. Set check intervals based on how damaging downtime would actually be for each one.
Configure confirmation rules, not just on/off checks (20 minutes). Set retries — two or three failed attempts — multi-region confirmation where available, and separate warning versus critical thresholds for latency.
Add SSL and DNS monitoring (10 minutes). Set expiry alerts at 30, 14, and 7 days, and turn on change detection for your important DNS records, not just uptime pings.
Test alert delivery end to end (10 minutes). Trigger a test alert and confirm it actually reaches the right person on the right channel, whether that's Slack, email, or a webhook. An alert nobody sees is worse than no alert at all.
Publish a status page and rehearse using it (15 minutes). Set up component-level status and walk through, even briefly, what you'd post during a real incident.
That's roughly two hours, spread across steps you can tackle in whatever order suits your team.
Choosing a Tool for Uptime Monitoring and Other Checks
I'm one of the people behind Moonitor, so take this section as disclosure rather than neutral advice: this is the kind of setup we built Moonitor to make easier, because piecing together separate tools for uptime, SSL, DNS, and cron monitoring is genuinely tedious. Most DIY setups end up with one or two of these gaps by accident, not by choice.
Moonitor covers eight monitor types — HTTP/S, keyword checks, port and ping, SSL and domain expiration, cron and heartbeat, and DNS record change detection — in one dashboard, with multi-region confirmation built in. Alerts can go to Slack, Discord, Telegram, email, or your own webhooks, and a branded status page is included.
Pricing is in US dollars: the Solo plan starts at $14/month (roughly £11, though check current exchange rates and VAT treatment for your business) for 20 monitors, scaling up to unlimited monitors on the Max plan at $49/month. There's a 7-day free trial, no card required. Whatever tool you choose, Moonitor or something else, the checklist above is the part that actually matters.
Monitoring Setup FAQ
How do I know if my monitoring setup is insufficient?
The clearest tell is timing: if you find out about outages from customers instead of your own alerts, your monitoring isn't doing its job. Other signs include frequent false positives, no SSL or DNS coverage, and a team that's stopped trusting the alert channel.
What are the most common mistakes in DIY monitoring setups?
Checking from a single location, which causes false alarms from local network blips; only monitoring the homepage instead of checkout, login, and APIs; and forgetting SSL certificate and DNS monitoring until something breaks — these are the mistakes I see most often.
How do I reduce false alerts from my monitoring tool?
Combine multi-region confirmation with retry logic — two or more failed attempts before alerting — and sensible latency thresholds. This cuts down false positives caused by network blips quite a bit, though it won't catch application-level bugs that genuinely cause slow or broken responses.
How far in advance should I get warned about SSL certificate expiry?
A 30/14/7-day warning schedule gives you enough runway to renew without last-minute panic, and enough repetition that a single missed notification doesn't turn into an outage.
Is it worth paying for monitoring if I'm a small team?
Usually, yes. Plans like Moonitor's Solo tier start at $14/month for 20 monitors, which is often cheaper than the cost of one missed sale or one 2am scramble caused by a false alert. Check current UK pricing and VAT treatment before committing, since most monitoring tools price in US dollars by default.