
API Monitoring Best Practices: How to Catch Failures Before Your Users Do
Master API monitoring with API uptime checks, response time analytics, endpoint monitoring and incident alerting—catch failures before UK users do.
API Monitoring Best Practices: How to Catch API Failures Before Your Users Do
A practical guide to API monitoring, uptime checks, response time analytics, and incident alerting: what to check, how to set sensible thresholds, and how to catch failures before your customers do.
Effective API monitoring goes well beyond a simple 200 OK check. You need to verify response payloads, authentication flows, and performance trends, not just whether the server responded. Combine multi-region API uptime monitoring with response time analytics and smart, low-noise incident alerting, and you can catch problems while they're still small, quiet issues rather than customer support tickets.
Here's a scenario I've seen play out more times than I'd like to admit: an API returns a 200 status code right on schedule, every time the monitor checks it. The dashboard is green. Everyone's happy. Except behind that green checkmark, the endpoint has quietly started returning an empty JSON object instead of the order data a client app expects. The app crashes silently for a chunk of users. Nobody notices for three hours, until a customer emails support asking why their integration went dark.
The API was technically "up" the entire time. It just wasn't doing its job.
That gap between "the server responded" and "the API actually worked" is where a lot of endpoint monitoring setups fall short. Let's fix that.
Why API uptime alone isn't enough
The classic mistake teams make is treating API monitoring exactly like website monitoring: ping the endpoint, check for a 200, call it done. That works fine for a marketing site. It falls apart fast for an API, because an API can be technically reachable and functionally broken at the same time.
Modern APIs fail in subtle ways that a basic uptime check simply can't catch:
- Degraded performance: the API responds, but it takes eight seconds instead of 200 milliseconds
- Partial outages: some endpoints work fine while others quietly fail
- Authentication and token issues: something breaks in the auth service, and protected routes go down while public ones stay up
- Third-party dependency failures: your API leans on a payment processor, database, or external service that's having a bad day
Effective API monitoring means treating your API like the complex, living system it is, not a single yes-or-no light switch. That mindset shapes every part of a reliable endpoint monitoring strategy.
What should you monitor besides API uptime?
If uptime isn't the full picture, what should you actually watch? It helps to split monitoring into two buckets: synthetic checks that mimic what a real client would do, and internal telemetry that helps you figure out why something broke once you know it did.
Synthetic API monitoring checks
Synthetic checks measure customer-facing behaviour from a controlled set of locations:
- Endpoint availability across every critical route, not just your root endpoint or homepage. If your API has /users, /orders, and /payments endpoints, each one needs its own check. A setup that only watches /health will miss a broken /payments route every time.
- Response payload validation: confirming a response arrived isn't enough, check that it actually contains the expected structure, values, or required fields. If your API is supposed to return a status: "success" field and it suddenly doesn't, you want to know right away. Define what "failure" means precisely: a missing field, wrong type, or unexpected null should each be unambiguous in your checks.
- HTTP status code accuracy: sometimes a server returns a 200 when it should return a 500, or the reverse, especially behind proxies or misconfigured error handling. Cross-checking status codes against expected payload content catches these mismatches.
- Authentication flow success: test protected endpoints with a dedicated, least-privilege monitoring account so expired tokens, permission changes, and auth service problems don't go unnoticed.
- API contract and schema validation: an unexpected field removal, renamed key, or type change can break client integrations even when the endpoint technically works.
Infrastructure and API dependency monitoring
Your API's real reliability also depends on the infrastructure and services sitting behind it:
- SSL certificate validity for every HTTPS endpoint. An expired certificate can quietly break API calls for clients enforcing strict SSL verification.
- DNS record monitoring, especially if your API sits behind load balancers or CDN routing. DNS changes, intentional or not, can redirect traffic somewhere it shouldn't go.
- Dependent services and third-party integrations your API relies on. If your API calls a payment gateway or email service, that dependency is part of your real availability.
- Ports, hosts, and network connectivity, wherever relevant to your architecture and internal services.
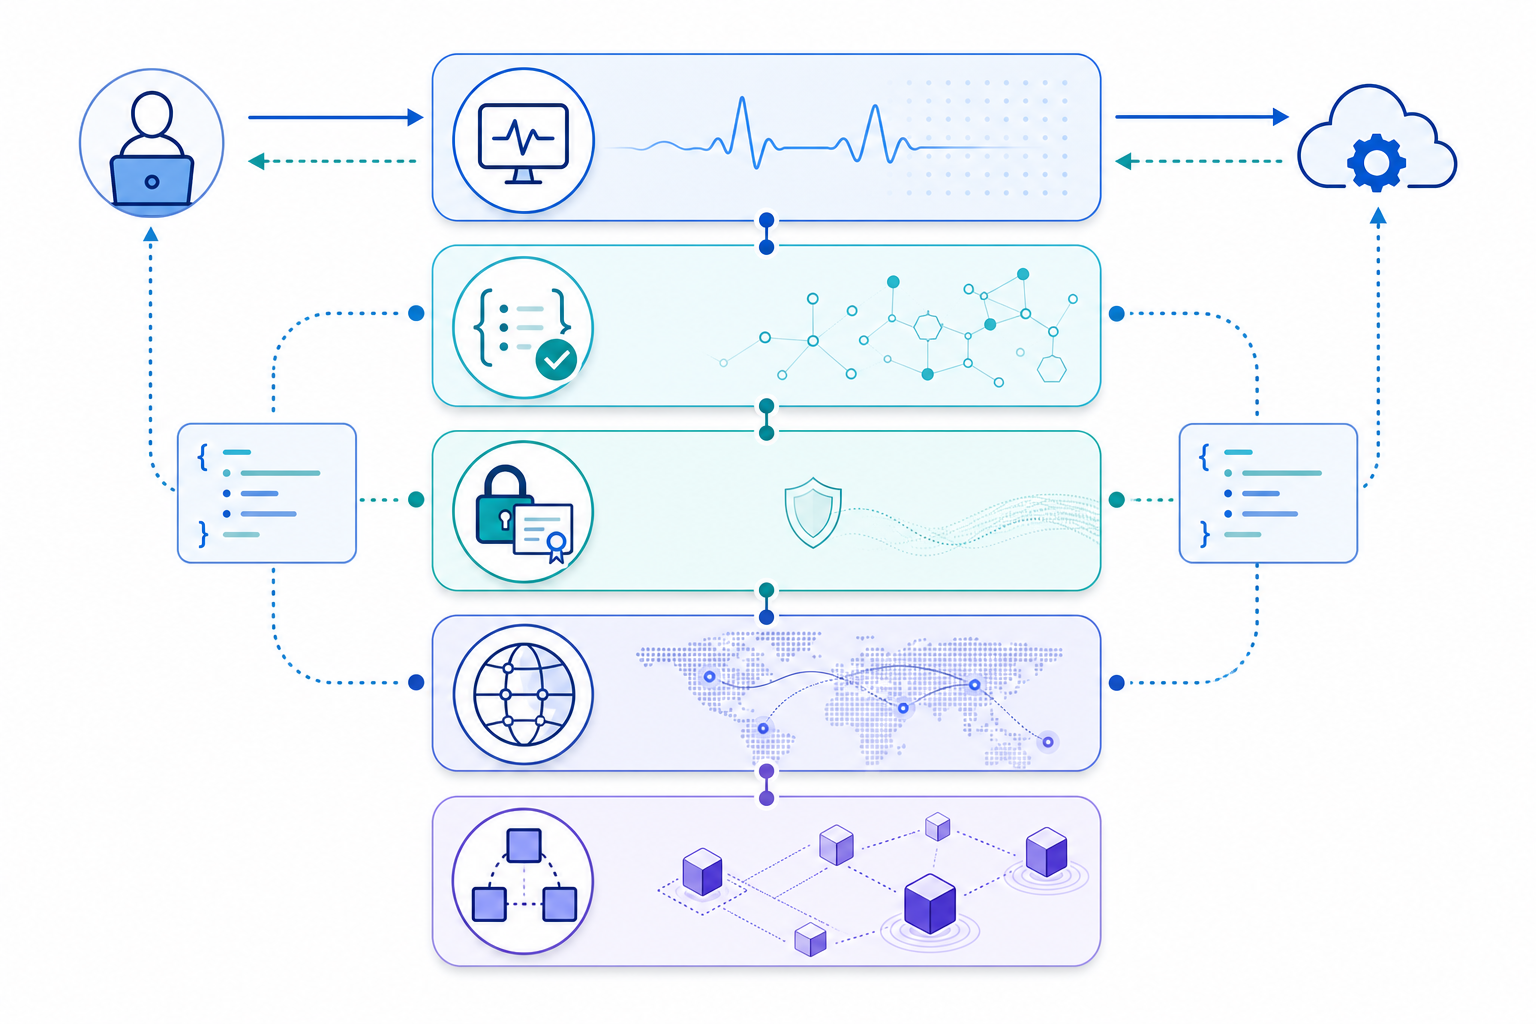
Tools like Moonitor cover several of these monitor types, HTTP/S, keyword, port, ping, SSL and domain expiration, cron/heartbeat, and DNS record change detection, from one dashboard. That's handy if you're currently stitching together three or four tools to cover the same ground. Whatever you choose, the principle matters more than the product: layer these checks across the same critical endpoints so nothing slips through unnoticed.
How to set realistic API response time thresholds
Response time thresholds sound simple until you actually try to set one. "Alert me if it's over 500ms" feels reasonable, until you realise your API naturally runs at 480ms during peak hours in one region and 150ms in another. Now you're either drowning in noisy alerts or missing real degradation because your threshold was a guess dressed up as a number.
Start with data, not intuition. Review your historical response time analytics for at least a week or two before setting anything. What does "normal" actually look like for this specific endpoint and region? Response times naturally shift by time of day, day of week, and geography. Someone hitting your API from Manchester will see different latency than someone in Singapore, and that's not automatically a problem.
Set thresholds per endpoint and per monitoring region rather than using one number for everything.
Use percentiles instead of averages
Percentile-based thresholds tend to be more useful than flat averages, because an average can hide a lot of pain. If 90% of requests return in 100ms but 10% take four seconds, the average might still look fine while a real chunk of your users are having a miserable time.
Watch p95 and p99 response times to see what your slower traffic is actually experiencing. Keep in mind that percentiles from synthetic monitoring reflect what your monitors saw, not necessarily what every real user experienced. They're a strong signal, not a perfect substitute for real-user monitoring, so pair them with application-level telemetry where you can.
A useful threshold ties back to a service-level objective rather than a bare number. For example:
95% of requests to /orders should complete in under 800ms over a rolling 24-hour period.
Use separate warning and critical levels, and require a sustained breach, three consecutive failed checks, say, before alerting. That alone prevents a single slow response from turning into unnecessary noise.
Look for gradual performance degradation
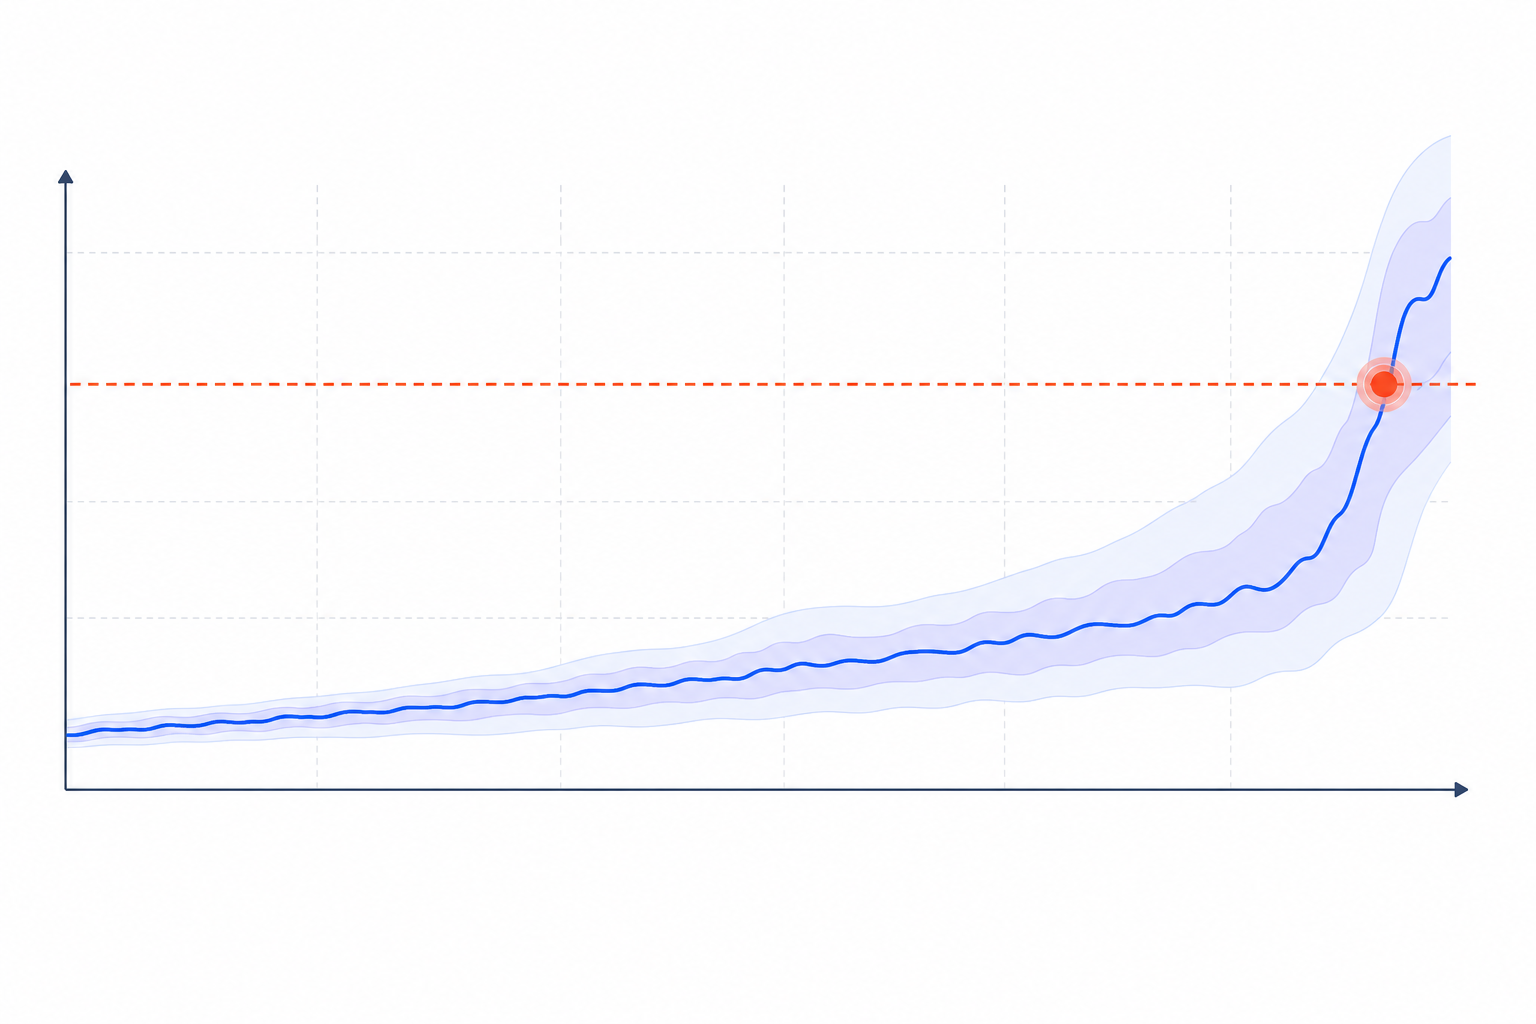
A response time that creeps from 200ms to 600ms over two weeks might never trip a flat threshold, but it can be an early warning: a database query slowing down as data grows, a memory leak, a dependency quietly degrading.
Review response time trends over weeks, not just moment-to-moment status. This is one of the more effective ways to catch a slow-motion failure before it turns into a 3am outage.
How to monitor authentication and API payload correctness
A lot of API failures happen around authentication and data correctness, places where a basic uptime check has zero visibility. Here's what actually makes endpoint monitoring representative of real client behaviour.
Test authenticated endpoints directly, not just public ones. Token expiry, permission changes, and auth service problems are common silent failure points. Use a dedicated, least-privilege monitoring account rather than a real customer or admin credential, and store its secrets in your monitoring tool's secret manager, rotating them regularly.
Validate response bodies for their expected structure, not just status codes. Check for specific keywords, required JSON fields, and expected values. If /orders should always return an array, flag it if it ever returns null.
Monitor changes to the API contract. A field getting removed, renamed, or switching type (string to number, say) can break client integrations even when the endpoint returns a successful status. Use schema or structural checks where your tool supports them; even a lightweight JSON Schema check can catch contract breaks before customers do.
Check rate-limiting behaviour under normal and high-traffic conditions. Confirm limits kick in when they should without throttling legitimate traffic during busy periods. Use a sandbox or staging environment where you can, since firing high request volumes at production carries unnecessary risk.
Schedule checks that mimic real client behaviour, including POST and PUT requests where relevant. Be careful writing test data to production: poorly designed checks can create duplicate orders, payments, or records. Use a dedicated test tenant or clearly flagged synthetic records, idempotency keys, and a cleanup step. Keep test payloads sanitised and free of real personal data, especially if you operate under UK GDPR.
A well-designed check should look like how your API actually gets used in production, without letting monitoring itself become a source of bad data.
API incident alerting strategies that reduce noise
Good monitoring is only half the job. The other half is getting alerts to the right people at the right time without burying your team in noise. A practical alert lifecycle looks like this:
Detect → debounce → deduplicate → route → escalate → recover → review
- Reduce alert fatigue. When teams get pinged for every minor blip, they start tuning alerts out. Debouncing, requiring a failure to persist for a minute or two, or show up across several consecutive checks, filters out most of that noise.
- Verify failures across multiple regions. A single failed check might just be a local network hiccup near the monitoring node rather than an actual outage. Confirming failure from more than one region before alerting cuts down false positives. That said, genuinely regional outages still need region-aware rules rather than a strict "fail everywhere" condition.
- Deduplicate related alerts. If five endpoints fail because one upstream database went down, your team needs one incident, not five separate pages.
- Route alerts to the right channel. Slack or Teams works well for team-wide visibility during an active incident. Email suits lower-urgency issues. Webhooks can trigger automated remediation, like restarting a service or scaling resources.
- Build clear escalation policies. Define who gets notified first and when an unacknowledged alert escalates to the on-call engineer. If your team works UK business hours but serves customers globally, write down how overnight incidents get handled.
- Send recovery notifications. Teams that only hear about failures tend to assume an incident is still live. Recovery alerts close that loop.
- Review incident history for patterns. If the same endpoint fails every Tuesday around peak traffic, that pattern probably points to something underlying. Regular incident reviews help you fix root causes instead of just closing individual alerts over and over.
Using response time analytics to spot API trends
The real value of response time analytics shows up when monitoring stops being purely reactive. Use the data to catch trouble while it's still small, and to understand why a problem happened in the first place.
Say the p95 response time on /checkout sits at 300ms for weeks, then jumps to 900ms right after a Wednesday deployment. That's worth investigating, even if it's not technically an outage yet. Correlate the timing with your deployment log, look at the diff, check database query plans if the release touched a query, and see whether the increase is holding steady or already reversing.
If it's tied to the deployment, your next move might be a rollback or a hotfix. If it started before the deployment, look elsewhere, a dependency issue, maybe, or a shift in traffic patterns.
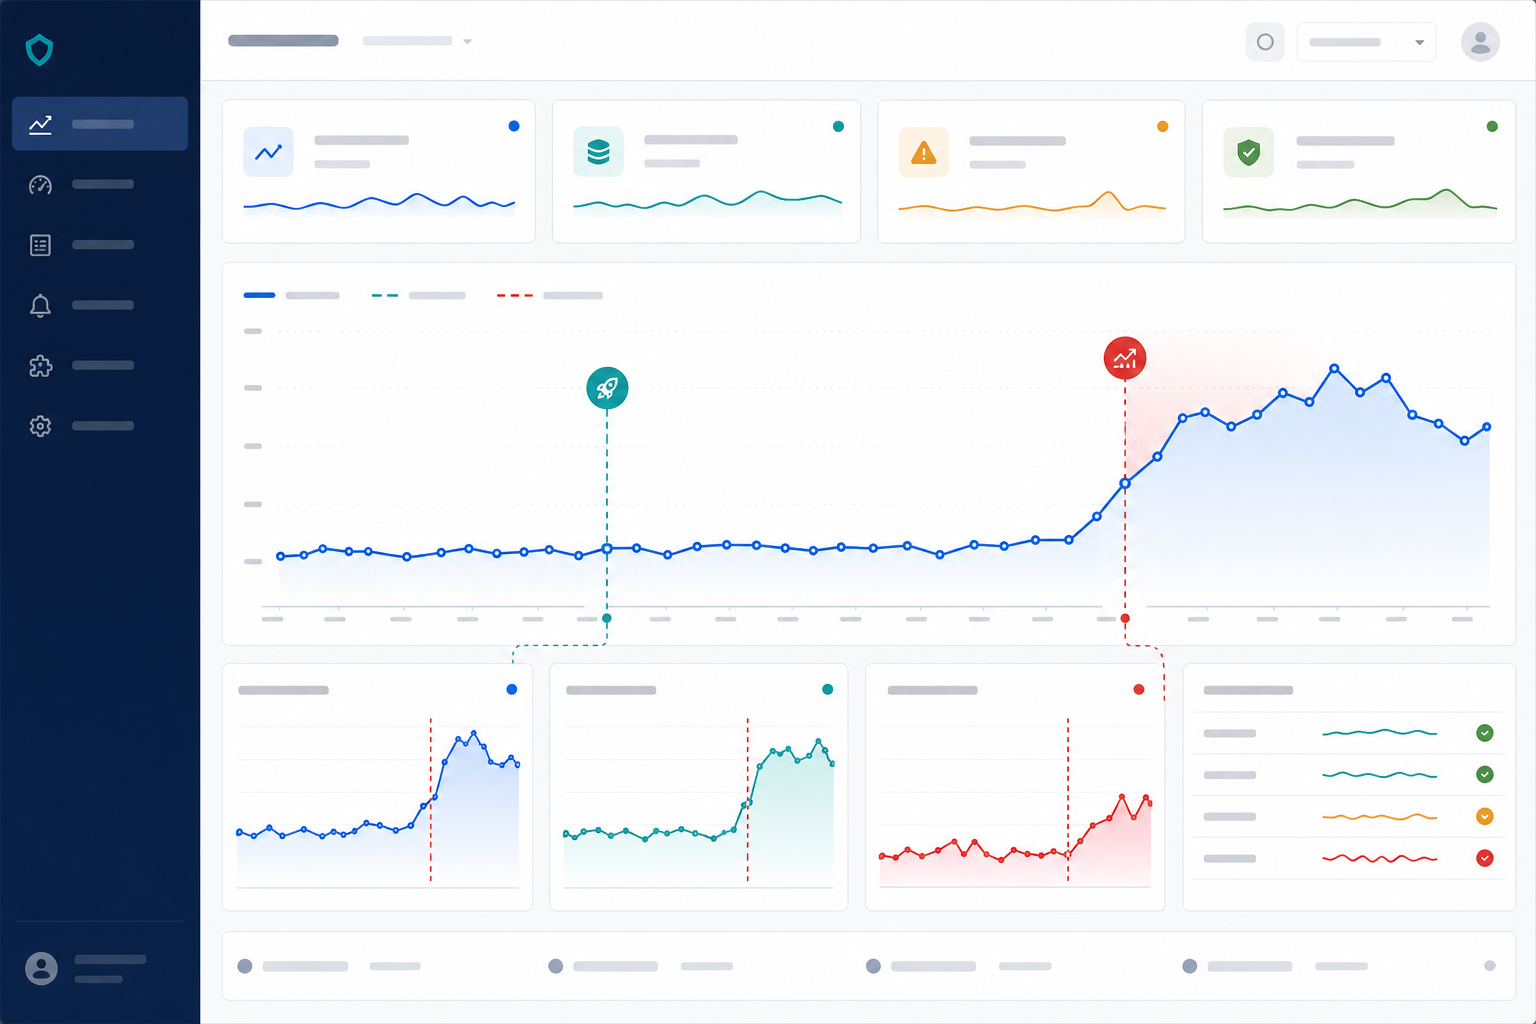
Build the habit of correlating response time changes with known events: deployments, marketing campaigns, third-party incidents. Where you can, cross-reference monitoring data with logs and traces to actually confirm the cause instead of trusting a graph on its own.
Sharing some of this data externally can build trust too. A branded public status page showing current uptime and recent incident history tells customers your team is paying attention, even when something breaks. Exportable monitoring data can also feed internal dashboards and incident postmortems without locking you into one vendor.
Practical API monitoring checklist
Use this checklist to review your current setup:
- Monitor every critical endpoint, not only the primary endpoint
- Validate payloads and status codes together, never status codes alone
- Set response time thresholds using p95 and p99 data tied to a clear SLO
- Require a sustained breach rather than a single blip before alerting
- Send recovery notifications when incidents are resolved
- Use multi-region checks to reduce false positives from local network problems
- Apply region-aware rules for genuinely regional outages
- Use least-privilege, rotated credentials for authenticated checks
- Keep test data sanitised and isolated from real customer records
- Add cleanup logic or idempotency keys to POST and PUT checks
- Route alerts to the right channel with clear, out-of-hours escalation paths
- Maintain a public status page so customers are not left guessing
- Review response time trends monthly and correlate changes with deployments and known events
If you're missing more than a couple of these, it's worth setting aside time to shore things up. Future-you, dealing with a 2am incident, will thank present-you for it.
API monitoring FAQ
What's the difference between API monitoring and website monitoring?
Website monitoring typically checks whether a page loads and returns a 200. API monitoring needs to go deeper, validating response payloads, checking auth flows, verifying data structures, and tracking performance across multiple endpoints. APIs get consumed programmatically, so failures are often invisible to a simple status check.
How often should I check API endpoints?
For most production APIs, checking every one to five minutes strikes a good balance between catching issues quickly and not hammering your infrastructure. High-traffic, critical endpoints might warrant a check every minute, while lower-priority internal APIs can usually get checked less often.
Can API monitoring catch issues before customers report them?
Often, yes. By continuously watching payload correctness, response times, and authentication success rates, you can spot degradation or failures minutes, sometimes hours, before a customer notices. That buys your team time to investigate and fix things quietly.
Monitoring isn't foolproof, though. It has blind spots, particularly for issues affecting a narrow slice of users or regions your checks don't cover. Think of strong API monitoring as a significant reduction in detection time, not a guarantee you'll catch everything before customers do.
Do authenticated endpoints need different monitoring?
Generally, yes. Authenticated endpoints can fail because of token expiry, permission changes, or auth service outages that don't touch public endpoints at all. Set up separate checks that handle the auth flow using a dedicated, least-privilege test account. That way you catch authentication failures without exposing real customer credentials.
What causes false positive API monitoring alerts?
Most false positives come from checking an endpoint from a single location. A brief network hiccup near that monitoring node can make a perfectly healthy API look down. Multi-region verification, combined with requiring a sustained breach, cuts down unnecessary alerts a lot, though it won't eliminate every edge case.