
Background Job Monitoring: The Metrics That Actually Matter (Beyond Pass/Fail)
Track background job monitoring beyond pass/fail with job monitoring metrics, queue monitoring, worker uptime and failure rate trends.

Background job monitoring: the job monitoring metrics that matter beyond pass/fail
Background job monitoring needs more than a success ping. If you're running scheduled jobs, there's a good chance your setup looks something like this: the job runs, it pings a URL when it's done, and if that ping doesn't show up, something's wrong. Simple. Effective. And not nearly enough.
Most job failures don't happen out of nowhere. They're preceded by a slow decay that a binary "did it run or not" check simply can't see. The metrics that actually matter include job duration and drift over time, job failure rate by job type, queue depth and worker uptime, and threshold-based alerting that flags trouble before it becomes an outage, not just after your job has already fallen over.
In this guide, I'll walk through the job monitoring metrics to track, how to calculate them, and how to set thresholds that catch real problems without paging you at 2am for nothing. I'll also flag where the standard advice (including some of my own defaults) needs qualifying for your specific workload, because a payment job and a cache warmer have almost nothing in common.
Why pass/fail monitoring isn't enough for background jobs
The classic cron monitoring setup is simple: your job pings a URL when it finishes, and silence means failure. It's the monitoring equivalent of a smoke detector. It doesn't tell you the fire is coming, just that it's already here.
For a long time, that was fine. Total failures are the obvious problem, and catching them quickly is genuinely valuable. But pass/fail checks completely miss jobs that still "pass" but are quietly getting worse.
I've seen this play out in a fairly typical way. A team had a nightly data sync job that pinged "success" every single night without fail. No alerts, no red flags, nothing to worry about, except the job had gone from taking 4 minutes to complete to taking 40 minutes over the course of a month. Nobody noticed, because it kept succeeding right up until the night it didn't. It finally timed out during a heavy load period, and by then the root cause (a missing index after a schema change) had been quietly compounding for weeks.
A quieter version of the same problem shows up with queues rather than single jobs. Picture a support ticket queue where every individual job still succeeds, zero failures, green across the board, but the oldest unprocessed ticket keeps getting older. Nothing has "failed" in the traditional sense. But if a customer's ticket has been sitting untouched for six hours, your monitoring has quietly missed the actual incident, because it was only watching for red flags, not for jobs falling behind.
That's the core problem with binary health checks: they treat "still running" and "running well" as the same thing. They're not. What you actually want is observability, a continuous picture of how your jobs behave over time, not just a single dot that says green or red.
Beyond pass/fail: what job monitoring metrics should you track?
Real background job monitoring means capturing more than a heartbeat. Here's what to record on every run, along with what each metric actually tells you and a starting point for alerting on it.
| Metric | What it measures | How to calculate it | Starting-point alert (tune for your job) |
|---|---|---|---|
| Execution status | Success, failure, timeout, or no-show (job never started) | Log status at job start and end; a no-show is detected when an expected trigger time passes with no start event | Alert immediately on no-show or timeout for critical jobs |
| Job duration | Time from start to completion on every run | Timestamp at start and finish, stored per run (not just averaged) | Alert when a run exceeds a baseline you define below |
| Time since last success | Staleness, how long it's been since the job last completed cleanly | Current time minus timestamp of last successful run | Alert if staleness exceeds the job's expected interval plus a grace period |
| Queue depth / oldest-job age | Backlog size and how long the oldest waiting job has been sitting | Count of unprocessed items; timestamp of oldest item vs now | Alert on oldest-job age crossing a business-relevant limit, not just depth |
| Retry count / retry success rate | How often a job needs multiple attempts to succeed | Count retries per run; divide retries that eventually succeeded by total retries | Investigate (don't necessarily page) when retry rate trends upward |
| Resource context | Memory or CPU usage during the run, where your infrastructure exposes it | Pull from your process manager or container runtime metrics | Alert on sustained spikes, not single-run blips |
On their own, each of these is useful. Together, they tell a story a single pass/fail check never could. A job that succeeds but takes twice as long, needs two retries, and shows a growing queue behind it isn't "healthy." It's a red flag waiting to become an incident. Tracking status alone would never surface that pattern.
One practical note if you're in the UK or EU: if any of this context includes job payloads (for example, logging record IDs or customer data to help debug a slow run), make sure you're scrubbing personal data before it lands in a monitoring dashboard or third-party tool. It's an easy thing to overlook when you're just trying to debug a slow job, and it matters under UK GDPR.
Job duration and drift over time
Drift is the slow, steady increase in run time that signals something is degrading, even though the job keeps technically succeeding. To make that useful rather than vague, you need three things defined: a baseline, an observation window, and a trend rule.
- Baseline: typically the rolling 7-day or 30-day average duration for that specific job. Don't compare across job types; a five-minute health check and a two-hour export need their own baselines.
- Observation window: the period you're comparing against the baseline. A single slow run is noise; a sustained deviation over several consecutive runs, or several days, is a trend.
- Trend rule: a simple version is "flag if the 7-day average has increased by more than X% compared to the 30-day average, for at least three consecutive days." That last condition matters. It stops a single busy Tuesday from triggering an alert.
A quick word on percentiles, since they come up a lot in this kind of monitoring: p50 is the median run, half your runs are faster, half are slower. p95 is the run time that 95% of executions fall under, which effectively shows you your worst realistic case while ignoring true outliers. If your p50 stays flat but your p95 starts climbing, that usually means a subset of runs (maybe ones hitting a particular data shape, or landing during a busy period) are starting to struggle. That's often the earliest visible sign of drift, well before it shows up in the average.
Common causes of increasing job duration
Common culprits behind drift include:
- A growing dataset that the job has to process (very common in sync or export jobs)
- Database index bloat or missing indexes after a schema change
- Upstream API slowdowns that your job is silently waiting on
- Resource contention with other jobs running on the same schedule
A couple of caveats worth naming honestly: seasonal and naturally variable jobs will trip a naive drift rule constantly. A month-end billing job that always runs longer on the 1st isn't drifting, it's just seasonal, and your baseline should account for that (compare against the same day last month, not yesterday). Low-frequency jobs, say, something that runs once a week, don't have enough data points for a 7-day rolling average to mean much. For those, compare against the last several runs at the same cadence instead.
This is one of the areas where Moonitor's response-time analytics and incident history are genuinely useful. Instead of a single "last run" status, you get duration trends charted across weeks or months, so drift shows up as a visible line rather than something you'd have to reconstruct from scattered log entries. It doesn't replace defining your own baseline and trend rule, but it does make the pattern visible instead of buried in logs.
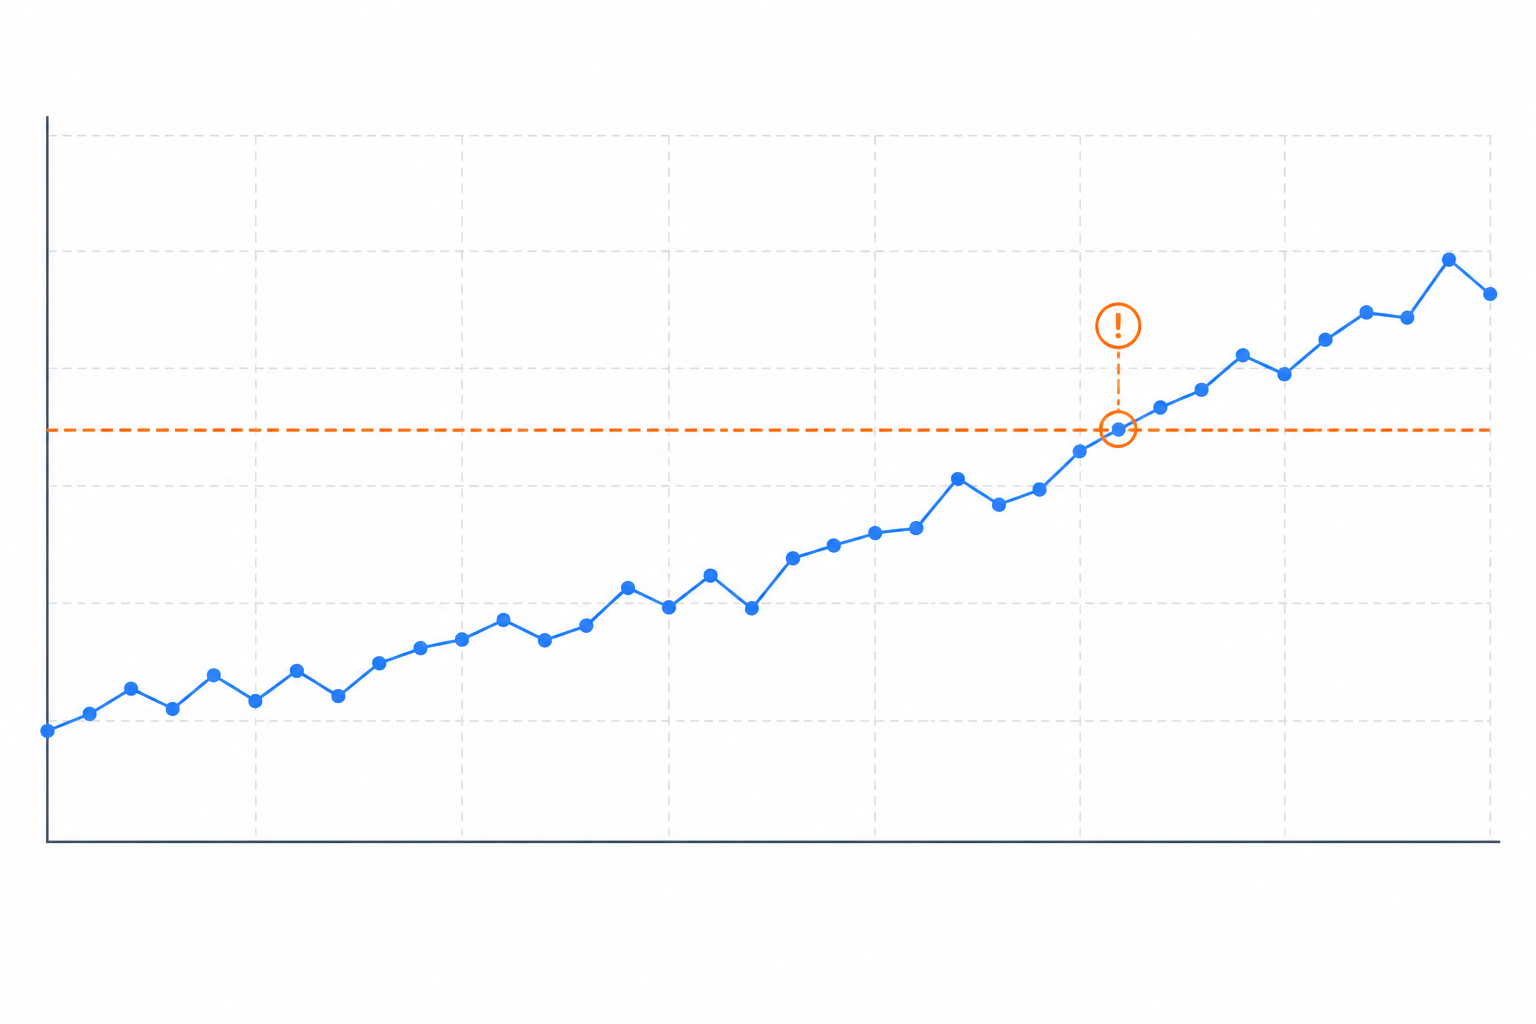
This chart illustrates the pattern to watch for: a job that keeps succeeding while its duration climbs steadily against a defined baseline, crossing an alert threshold well before it would time out.
Tracking job failure rate across job types
Not all jobs fail the same way, and they shouldn't be monitored the same way either. A nightly backup and a five-minute health-check ping have wildly different failure tolerances, but a lot of setups alert on both identically.
Start by calculating job failure rate: failures divided by total scheduled runs over a rolling window, typically 7 or 30 days. But treat that percentage carefully, sample size changes what it means. A job that runs 168 times a week and fails 10% of the time has failed roughly 17 times, which is a real pattern. A job that runs 7 times a week and fails 10% of the time has technically failed less than once, the number is nearly meaningless. As a rough rule, don't act on a failure-rate percentage until you have at least 20 to 30 runs in the window. Below that, alert on consecutive failures instead (for example, "two failures in a row") rather than a percentage.
Then group your jobs by criticality. The numbers below are illustrative starting points, not universal defaults. Tune them to how your job actually behaves and how many times it runs:
| Job Category | Example | Illustrative Failure Tolerance | Alert Approach |
|---|---|---|---|
| Critical | Payment reconciliation | Near 0% | Alert on first failure, regardless of run count |
| Important | Daily report generation | Low, tracked weekly, with a minimum of ~20 runs before trusting a percentage | Alert if failure rate crosses a small threshold, or on 2 consecutive failures |
| Low-stakes | Cache warming | Higher tolerance | Alert only on a sustained trend across many runs |
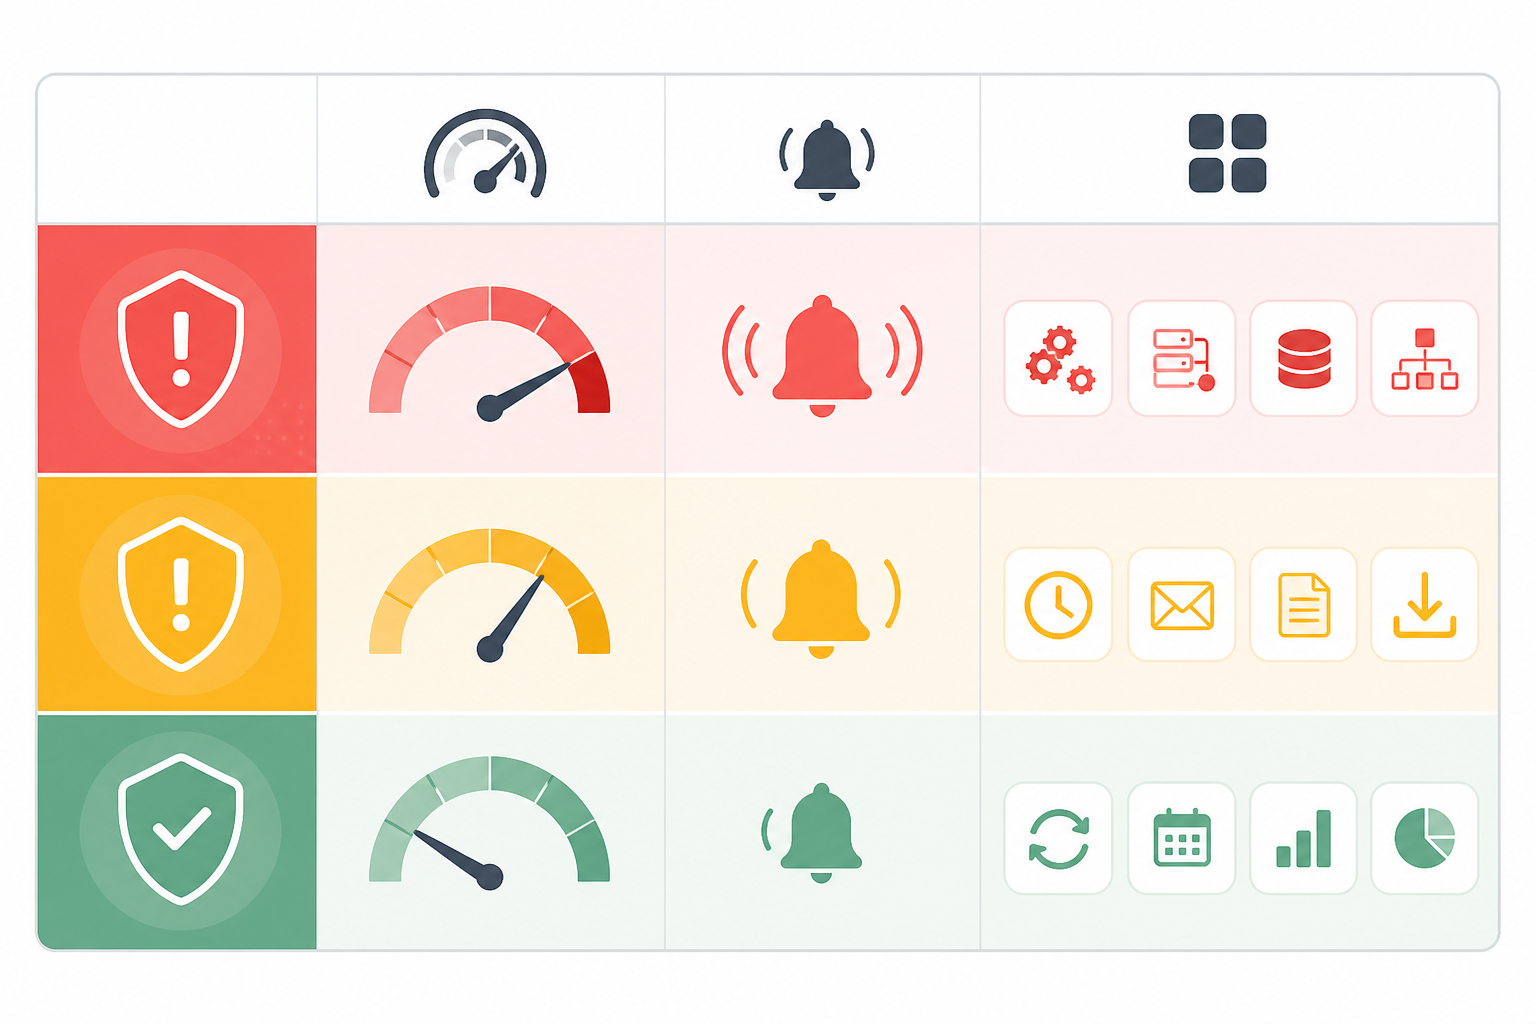
The insight here isn't the specific percentages, it's that alert sensitivity should scale with how much a failure actually costs you, not be applied uniformly across every job.
Once you're tracking failure rate by category, patterns start to jump out. Does your failure rate spike on deploy days? Does it climb at a certain time of night when a shared resource gets hammered? Did it start creeping up right after an upstream API changed its rate limits? These are the kinds of correlations you'll only spot by looking at trends rather than reacting to each failure as an isolated event.
One UK-specific wrinkle worth planning for: the clock changes around BST and GMT twice a year can shift when scheduled jobs actually fire relative to UTC-based systems, which sometimes triggers false staleness alerts right after the switch. Worth a mental note (or a calendar reminder) each spring and autumn if your jobs are scheduled in local time.
Queue monitoring and worker uptime
If you're running job queues (Sidekiq, Celery, Bull, or similar), individual job success is only part of the picture, and it's often the smaller part.
Queue depth trending upward is one of the clearest early warning signs in distributed systems, but depth alone isn't enough. A queue can hold steady at a moderate depth while still being unhealthy, if the jobs sitting in it are getting older rather than being cleared. That's why oldest-job age (sometimes called queue latency) matters at least as much as raw depth. It tells you how long the person or process waiting for that job has actually been waiting, which is usually the number that maps to a real SLA.
Queue health metrics to monitor
A fuller picture of queue health includes:
- Queue depth: total items waiting
- Oldest-job age: how long the longest-waiting item has been sitting
- Throughput: jobs processed per minute/hour
- Arrival rate vs. service rate: if jobs are arriving faster than workers can process them, depth will climb no matter how "healthy" each individual job looks
- Retry and dead-letter queue volume: a growing dead-letter queue means jobs are failing repeatedly and being set aside, often silently
- Worker concurrency and saturation: how many workers are active versus how many you've provisioned, and whether they're maxed out
Worker uptime matters just as much as job success rate, but "uptime" alone can be misleading too. A worker process can be alive (technically running) while being stuck, unable to pull new jobs, or rejecting work due to a downstream dependency being unavailable. That's the difference between liveness (the process exists) and readiness (the process is actually able to do useful work). A worker stuck in that state won't show up as a failed job, because the jobs never got picked up in the first place. From the outside, your system looks quiet. From the inside, nothing's moving.
This is why heartbeat monitoring on the worker process itself, separate from individual job pings, earns its place. A practical setup: your worker's health loop pings a heartbeat monitor at a regular interval (say, every 60 seconds), and ideally that health check also confirms the worker is actively pulling from the queue, not just that the process hasn't crashed. If the ping goes quiet, or if it keeps reporting "alive" while the queue backs up, you get alerted regardless of whether any individual job has technically "failed." Moonitor's cron/heartbeat monitor type is built around this pattern: you're watching whether the thing responsible for running your jobs is genuinely making progress, not just whether it's still running.
Alerting on metric thresholds instead of simple failures
Failure-only alerts have one big problem: they tell you after the damage, not before. By the time a job has actually failed, you've often already missed the window where you could've caught it cheaply.
Threshold-based alerting flips that. Instead of waiting for a hard failure, set up alerts based on the metrics already covered, but treat every number below as a starting point to tune, not a rule to copy:
- Duration threshold: a common starting point is alerting when a run takes more than 150% of its own 30-day baseline, but a job with naturally variable runtime (say, one whose duration depends on how much data arrived overnight) needs a wider band, or a percentile-based threshold instead of a flat percentage.
- Failure rate threshold: a flat "10% over a rolling week" only makes sense once you have enough runs for that percentage to be meaningful (see the sample-size point above). For lower-frequency jobs, use consecutive-failure counts instead.
- Staleness threshold: alert if a job hasn't reported success in X hours, even with no explicit failure logged. Set X based on the job's actual schedule plus a grace period, not a round number that feels safe.
The trick to making this sustainable is reducing alert fatigue by tuning thresholds per job criticality rather than firing on every anomaly. If every minor blip pages someone at 3am, people start ignoring alerts, and that's how real incidents slip through.
Multi-channel alerting fits naturally into an escalation plan here. Quiet warnings, a job trending towards its duration threshold, say, might go to a Slack or Discord channel the team glances at during working hours. Genuinely urgent issues, like a critical job going stale, warrant something louder: a phone call, a message to an on-call rotation, or a webhook into your incident response tooling. Moonitor supports alerting across email, Slack, Discord, Telegram, and webhooks, which makes it straightforward to route warnings and critical alerts differently instead of dumping everything into one noisy channel.
One caveat on verification before alerting: confirming an issue from a second location before firing an alert works well for reducing false positives on things like website or API uptime, where a transient network blip between the monitor and your server is a real possibility. It's less reliable for cron or worker heartbeat failures, where the problem is usually internal to your infrastructure rather than a network hiccup along the way. A second check often just delays a genuinely urgent alert without adding much confidence. Use retry-before-alert logic where it fits the failure mode, not as a blanket rule everywhere.
Building a background job health dashboard
Once you know what to track, the next step is pulling it together somewhere you'll actually look. Here's how I'd approach it:
- Inventory every scheduled job and queue worker you're currently running blind on. You'd be surprised how many "set it and forget it" cron jobs exist with zero monitoring at all.
- Classify jobs by criticality, critical, important, low-stakes, so you know what alerting behaviour each one deserves before you set anything up.
- Set up heartbeat or cron monitors for each job, with expected run windows and grace periods that match how the job actually behaves (a job that sometimes runs a few minutes late shouldn't trigger a false alarm every time, and remember the BST/GMT switch mentioned earlier).
- Layer in duration tracking with a defined baseline and observation window, so you can see trends rather than a wall of pass/fail dots.
- Configure threshold alerts for drift, staleness, and failure rate, tuned per job, with minimum run counts for percentage-based thresholds.
- Put it all on one dashboard so status, history, and trends are visible at a glance, rather than scattered across log files and half-remembered incidents.
- Consider a public or internal status page so stakeholders can check job health themselves instead of pinging your team every time they're curious.
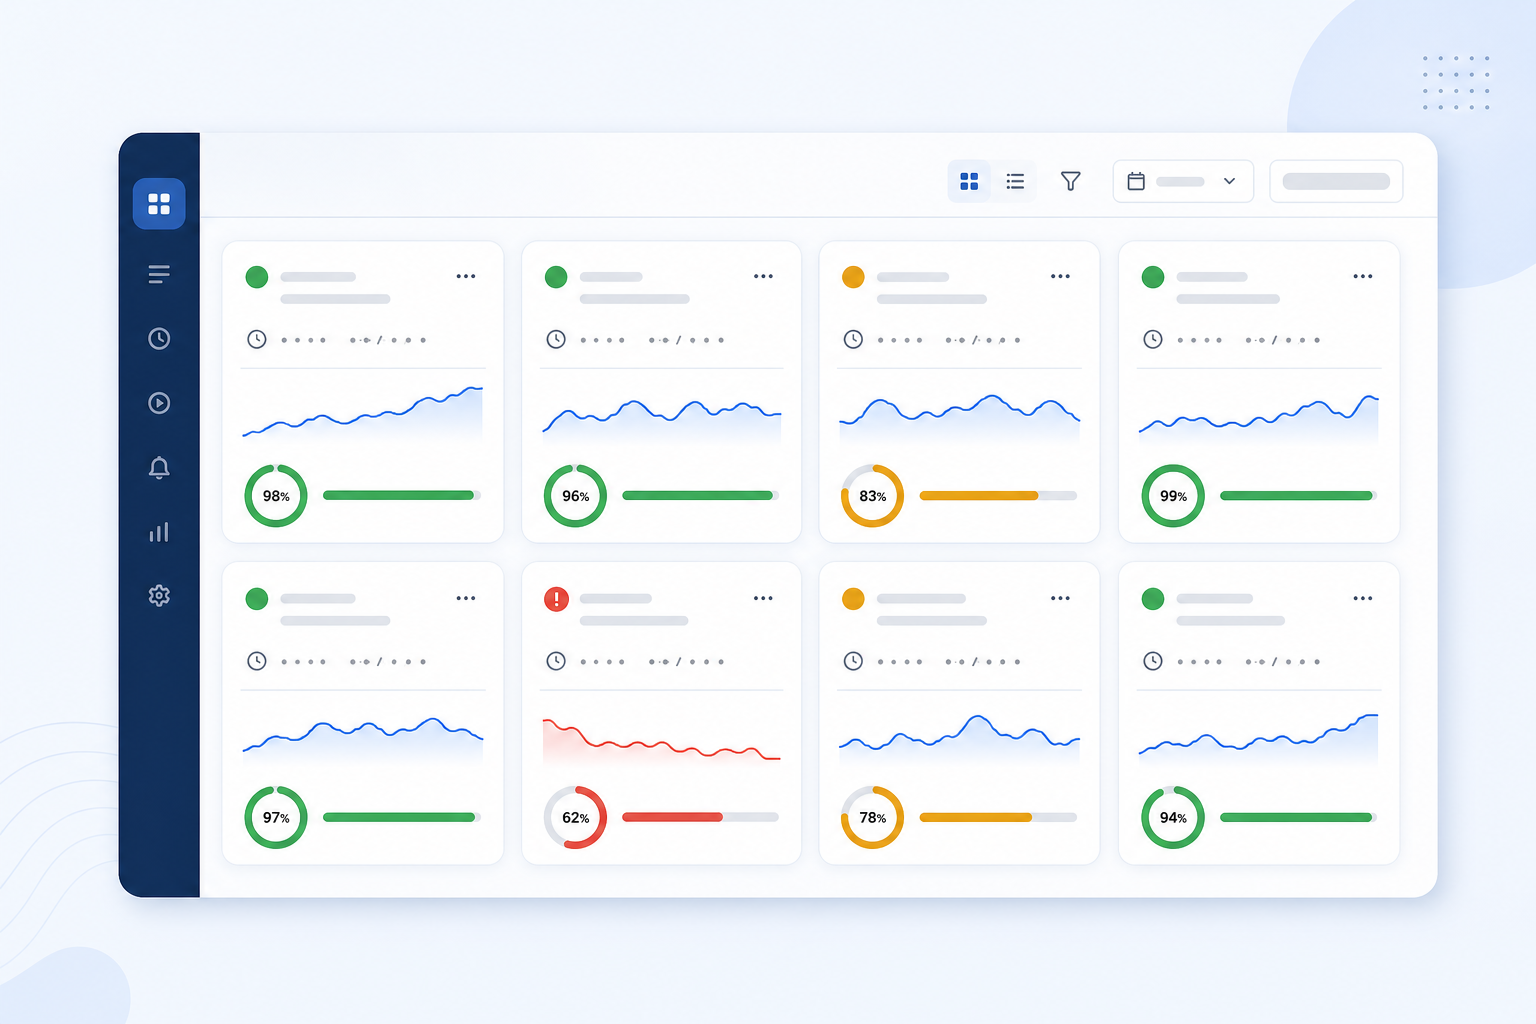
The goal shown here is a single view that answers "is everything actually okay" in under ten seconds, status, trend, and history together, rather than separate tools for each.
How Moonitor handles background job monitoring
This is the problem we built Moonitor to solve, so I'll be upfront that this section is about our product specifically. The principles above apply regardless of what tool you use.
The cron/heartbeat monitor type is built for scheduled jobs and background workers, rather than bending an HTTP uptime check into something it wasn't designed for. Multi-region verification helps cut down false alerts from transient network issues on the monitoring side. Incident history and response-time analytics give you the duration-over-time view this guide has been describing, so drift is visible as a trend rather than something you'd reconstruct from logs. And because HTTP/S, cron, port, SSL, DNS, and other monitor types live in one dashboard, you're not stitching together separate tools for your website, API, and job monitoring.
If you want to see the specifics (setup time, trial terms, and exactly which monitor types are available), it's worth checking the current pricing and product pages directly, since those details can change. The short version: it's built specifically for the patterns covered in this guide, and you can point it at your actual jobs to see what your own drift and failure-rate data looks like before deciding if it's the right fit.
Frequently asked questions about background job monitoring
What metrics should I track for background jobs?
At minimum: execution status (success, failure, timeout, no-show), job duration per run, time since last success, and retry counts. If you're running a queue, add queue depth, oldest-job age, and worker uptime. Together these catch both outright failures and the slow degradation that pass/fail checks miss.
How do I know if my job durations are trending badly?
Define a baseline (rolling 7-day or 30-day average), an observation window, and a trend rule. For example, flag a job if its recent average has risen more than a set percentage above baseline for several consecutive runs. Watching p95 alongside the median (p50) often catches trouble earlier, since a rising p95 with a flat p50 usually means a subset of runs are starting to struggle before it affects everything.
What's the difference between job failure and job drift?
Job failure is binary: the job errored out, timed out, or never ran. Drift is gradual: the job still completes successfully, but it's taking longer each time relative to its own baseline. Drift is often the early warning sign that precedes a future failure, so catching it lets you fix the root cause before it becomes an outage.
How is queue monitoring different from monitoring individual jobs?
Individual job monitoring tells you whether a specific task ran and succeeded. Queue monitoring looks at the system level: how many jobs are waiting, how old the oldest waiting job is, whether throughput is keeping up with arrivals, and whether the workers processing the queue are actually making progress. You can have zero failed jobs and still have a serious problem if oldest-job age is climbing because a worker is stuck.
What's a reasonable job failure rate threshold for alerting?
It depends on job criticality and, just as importantly, on how often the job runs. Percentage-based thresholds only mean something once you have enough runs in the window. As a rough guide, aim for 20-plus runs before trusting a percentage. Lower-frequency jobs are better served by alerting on consecutive failures rather than a percentage.
How do I monitor a job that only runs weekly or monthly?
Rolling 7-day averages don't work well with too few data points. Instead, compare each run against the last several runs at the same cadence (this month's billing run against the last three or four), and lean on consecutive-failure alerts rather than percentage-based failure rates.
What should trigger an alert on queue age versus queue depth?
Queue depth tells you volume; oldest-job age tells you impact. A queue can sit at a stable depth while the oldest item quietly ages past an acceptable wait time. That's usually the more actionable alert, since it maps directly to how long a user or downstream process has actually been waiting.