
Monitoring at Scale: How Growing Agencies Organize Infrastructure Monitoring Without the Chaos
Managing monitoring for dozens of clients? Here's how agencies scale their uptime monitoring strategy with smart organization, automation, and alert t
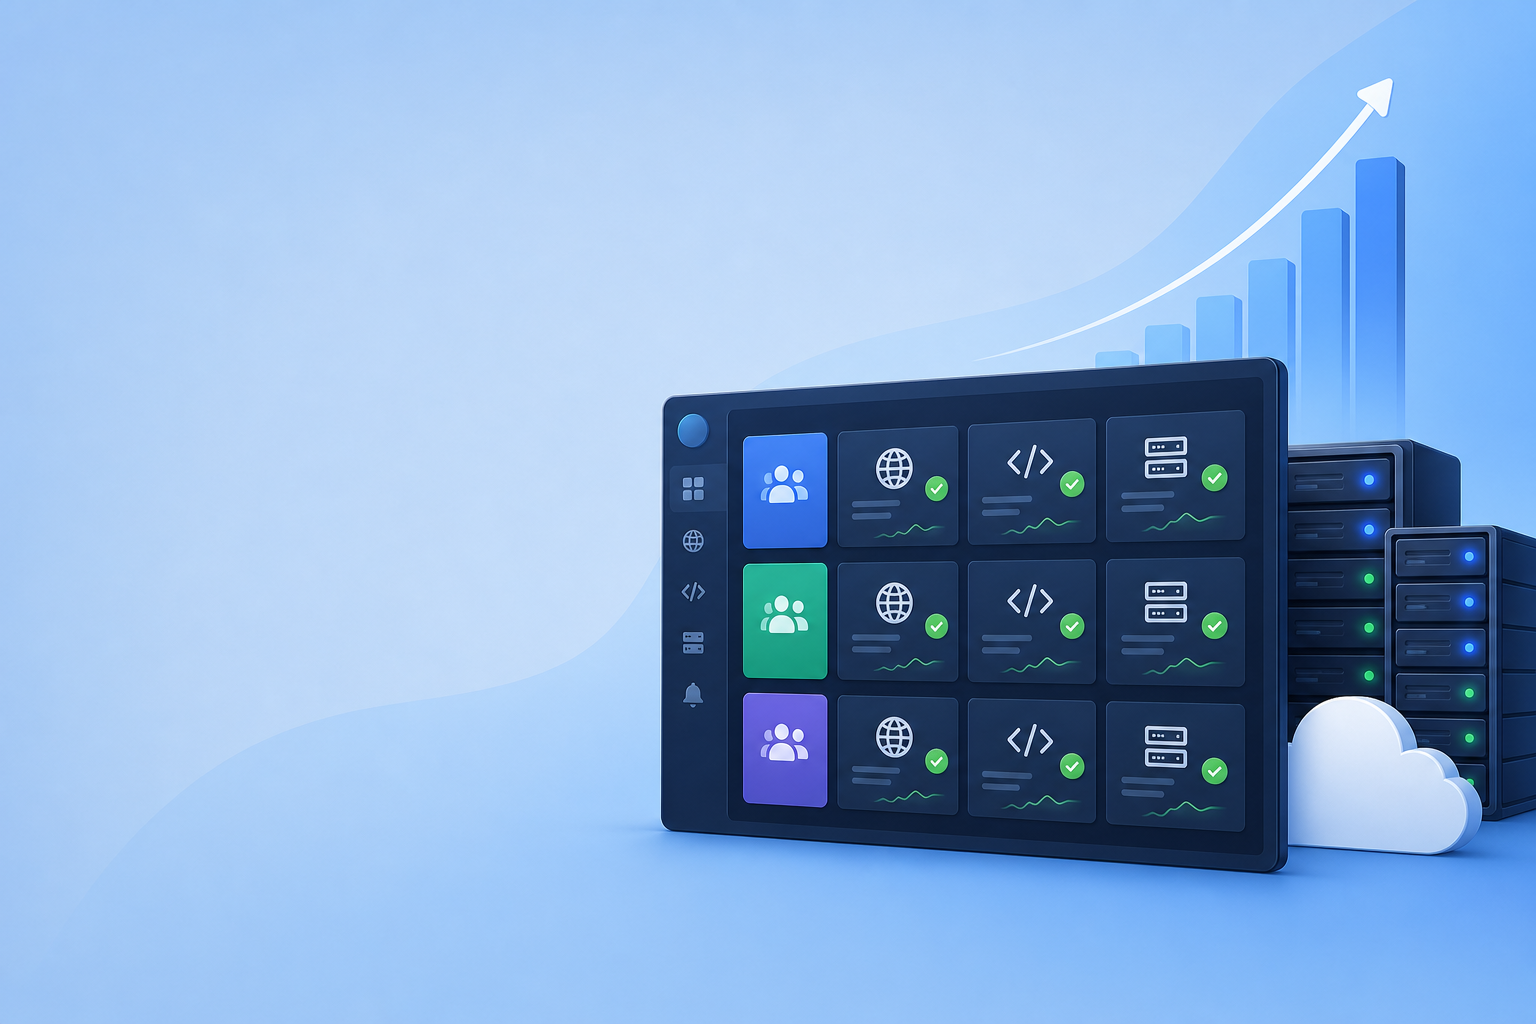
Monitoring at scale: how agencies organise infrastructure monitoring without chaos
Scaling your monitoring strategy isn't about adding more tools. It's about building structure before you need it. I've talked to a lot of agency owners who started with three or four clients and a handful of monitors, and it worked great. Then they hit twenty clients, then fifty, and suddenly their monitoring dashboard looked like a junk drawer nobody wanted to open.
The agencies that handle hundreds of monitors gracefully all do a few things well. They organise monitors by client and service using tags or groups. They automate monitor creation via API instead of clicking through a dashboard every time. And they deliberately design their alerting so noise doesn't drown out real incidents.
If that sounds like where you're headed, or where you already are, let's walk through how to build a scalable monitoring strategy using monitor organisation, a centralised dashboard and API monitoring automation.
Signs you've outgrown your current monitoring setup
Before we get into solutions, let's make sure we're diagnosing the right problem. Here's how I know an agency has quietly outgrown its infrastructure monitoring setup. These are the tells I hear again and again:
- You're manually creating monitors one at a time for every new client onboarded. If setting up monitoring feels like a chore you dread, that's your first clue.
- Nobody on the team can quickly answer "which monitors belong to which client?" You end up hunting through URLs to figure out whose site just went down.
- Alert fatigue has set in. People mute Slack channels because of noise. When your team starts ignoring notifications, your monitoring has stopped doing its job.
- You've had an incident slip through because it was buried among unrelated alerts. This is the scary one. It means the system failed at the exact moment you needed it.
- Your dashboard is a flat list of 200+ monitors with no visual hierarchy. Scrolling through an unsorted wall of green and red isn't monitoring. It's guessing.
- Onboarding a new client takes longer than it should because monitoring setup isn't repeatable. Every new project shouldn't feel like starting from scratch.
If you nodded along to even two or three of these, don't worry. This is an incredibly common growth pain, and it's completely fixable with the right structure.
How to organise monitors by client, service and environment
Here's something I've noticed: a flat monitor list works beautifully right up until it doesn't. Somewhere around 20 to 30 monitors, the wheels start to wobble. You can still technically scroll and find things, but it takes real effort, and effort is exactly what you don't have time for when something's on fire.
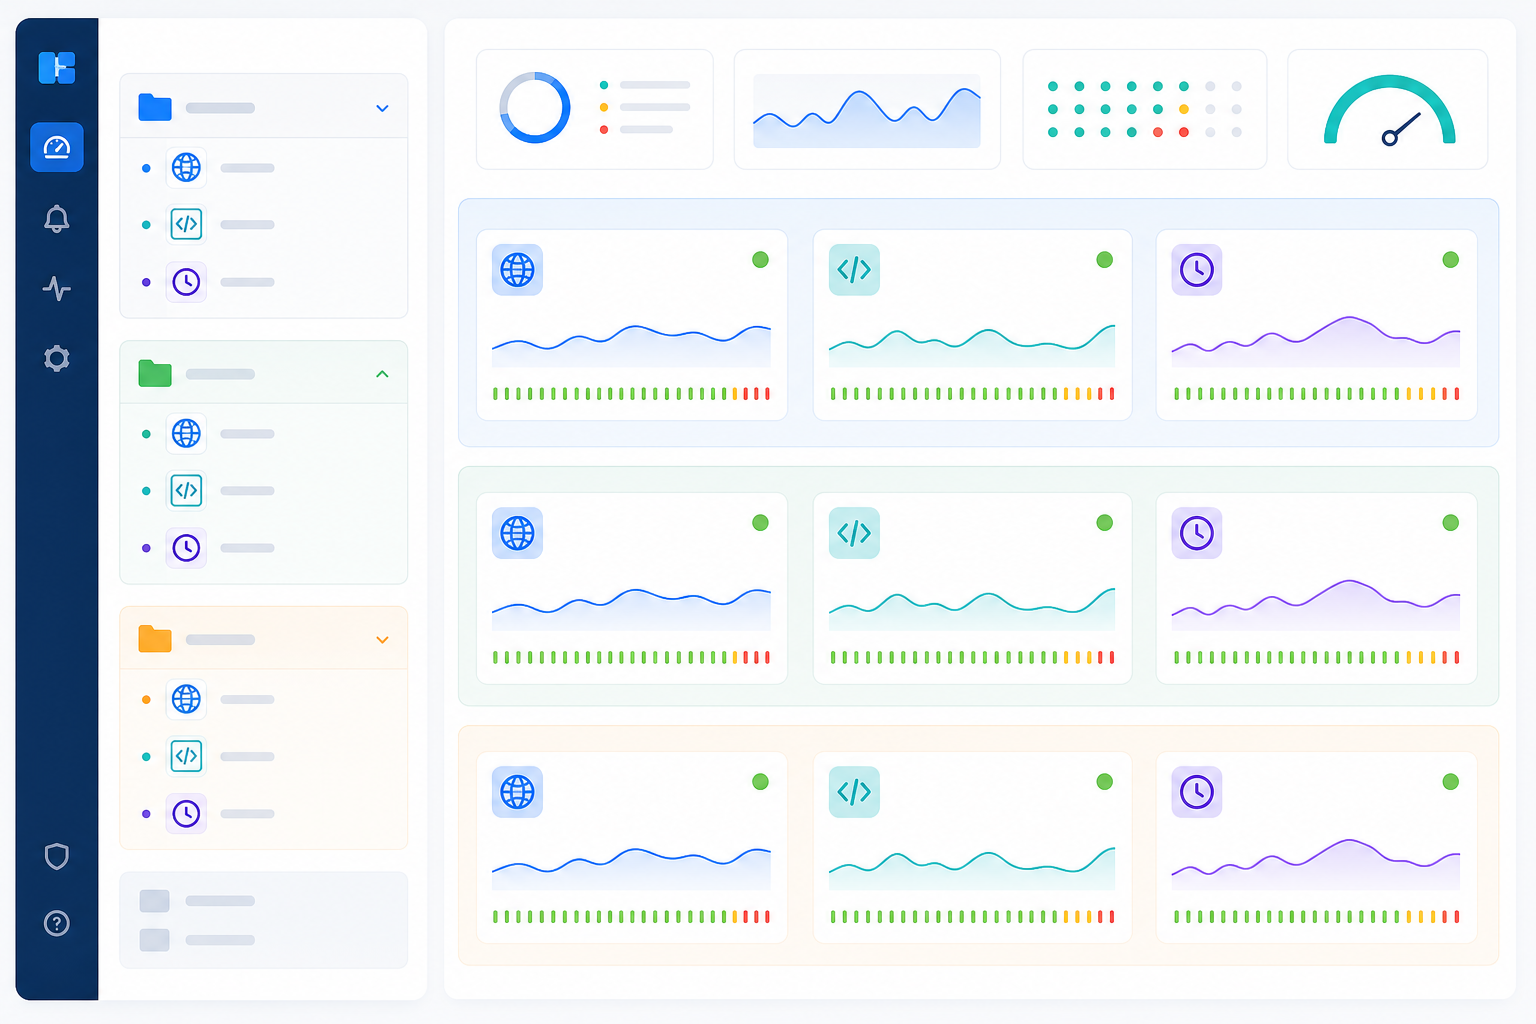
The fix is deceptively simple: tags. Most modern monitoring platforms, Moonitor included, let you tag monitors by client, by environment (production versus staging), or by service type (website, API, cron job or SSL check). Instead of one giant list, you get a filterable, sortable view of your infrastructure monitoring that actually reflects how your business is organised.
A naming convention helps just as much as tagging does. Something like ClientName-Service-Environment, for example Acme-API-Prod or Acme-Website-Staging, means anyone on your team can glance at a monitor name and know exactly what it is and who it belongs to, without opening a single tag panel. It sounds like a small thing, but when you're managing monitoring for dozens of clients, small things compound fast.
This kind of monitor organisation pays off most during incident triage. When an alert fires at 2am and your on-call engineer is groggy and stressed, a well-tagged monitor tells them instantly whose infrastructure is affected and what kind of service it is. That's the difference between a five-minute response and a twenty-minute scavenger hunt.
Here's a nice bonus: once your monitors are organised by client, setting up individual branded status pages becomes almost trivial. Each client gets their own public status page showing just their uptime monitoring data, not your entire client roster's. It looks professional, builds trust and saves your support team from fielding "is your service down?" emails.
And you don't lose the big picture, either. A centralised dashboard still lets you see everything in one place while filtering down to a specific client or service group whenever you need to zoom in. You get the best of both worlds: a bird's-eye view for the team and a laser-focused view for troubleshooting.
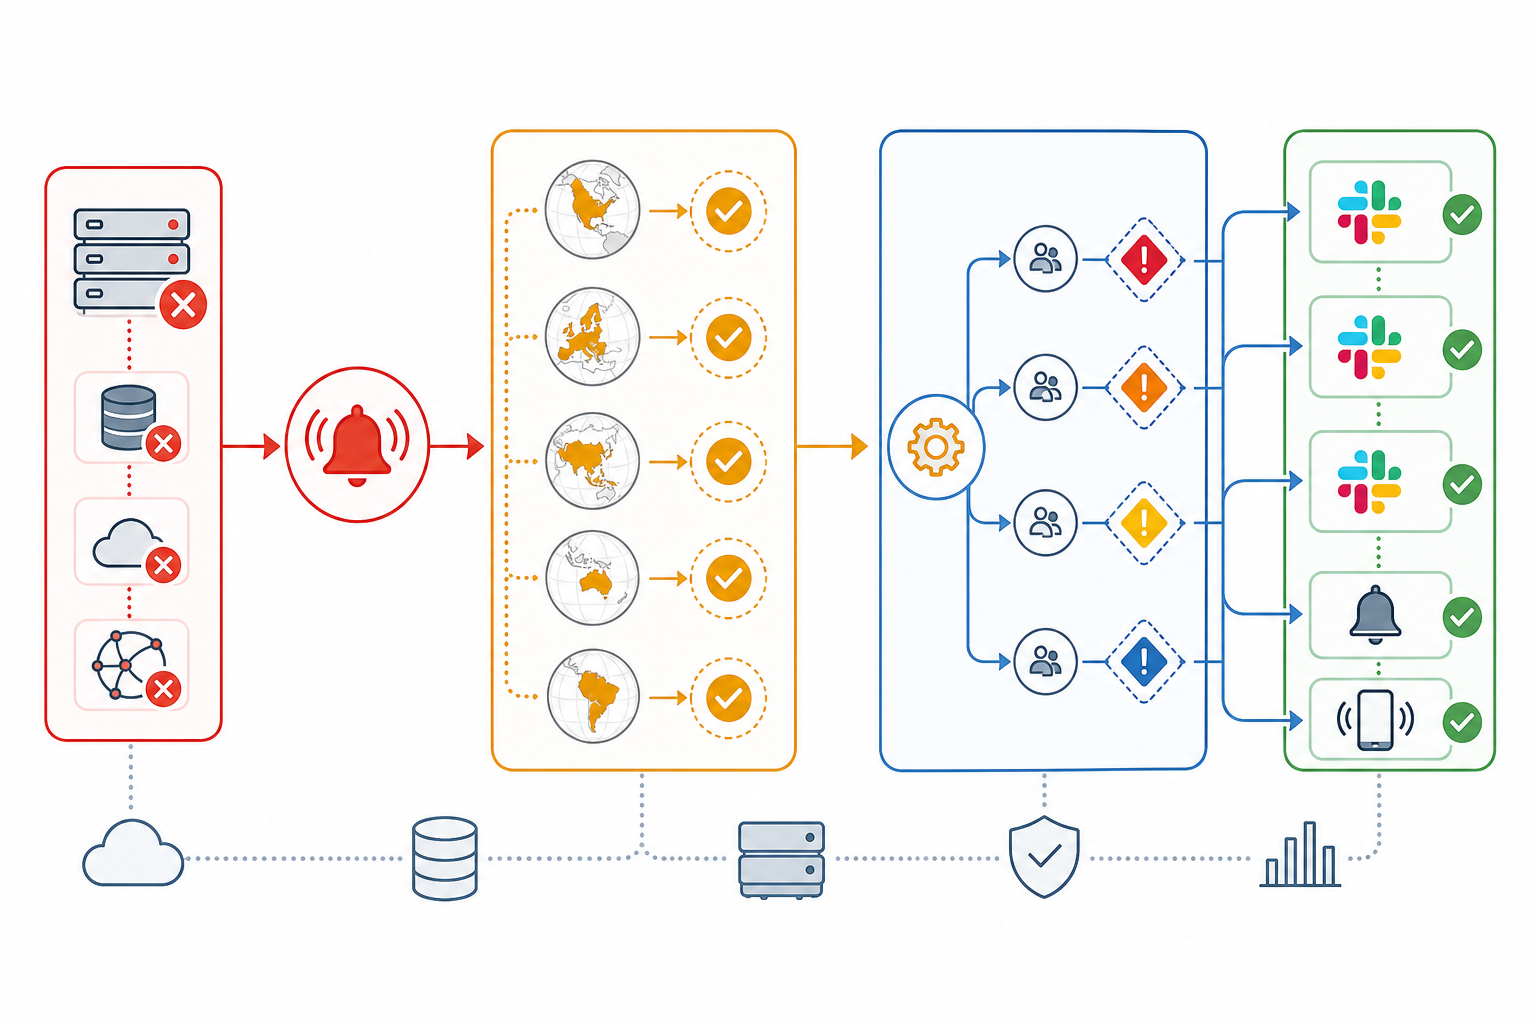
How to reduce alert overload when monitoring at scale
Here's a truth that catches a lot of growing agencies off guard: adding more monitors without smarter alerting just means more noise. If your alerting strategy was built for ten monitors and you now have two hundred, the volume of notifications alone will bury your team, even if every single alert is technically legitimate.
The goal isn't fewer monitors. It's smarter routing and filtering. A few things that genuinely move the needle:
- Route alerts by client or severity to different channels. A critical production outage for your biggest client shouldn't land in the same Slack channel as a minor staging environment blip. Separate channels, separate urgency, separate mental space.
- Use multi-region failure verification to cut down false positives. One of the most common causes of alert fatigue is a monitor flagging a site as down when it's really just a network blip from a single checking location. Moonitor verifies failures from multiple regions before firing an alert, so your team only gets pinged when something's actually wrong.
- Set sensible check intervals. Not everything needs 30-second polling. Your client's marketing site probably doesn't need the same aggressive check frequency as their payment API.
- Build real escalation paths. Decide in advance who gets pinged first and who gets looped in if that first alert goes unacknowledged for, say, ten minutes. This turns incident alerting from a free-for-all into a clear chain of responsibility.
- Review your incident history periodically. Look back at which monitors generate genuine signal versus which ones just create noise. If a monitor has cried wolf a dozen times with no real incident, it might need a longer interval, a different check type or a closer look at why it's flaky.
Think of alerting the same way you'd think of a good smoke detector setup for a large building. You don't want one alarm for the whole building triggering every time someone burns toast in a random kitchen. You want zoned, proportional alerts that tell you exactly where the fire is, if there even is one.
How to use API monitoring to automate monitor creation
Manual monitor setup works fine when you've got two or three clients. It falls apart fast once you're onboarding regularly. If your growth plan involves signing new clients every month, and hopefully it does, clicking through a dashboard to create the same set of monitors over and over is a waste of your team's time and an open invitation for mistakes.
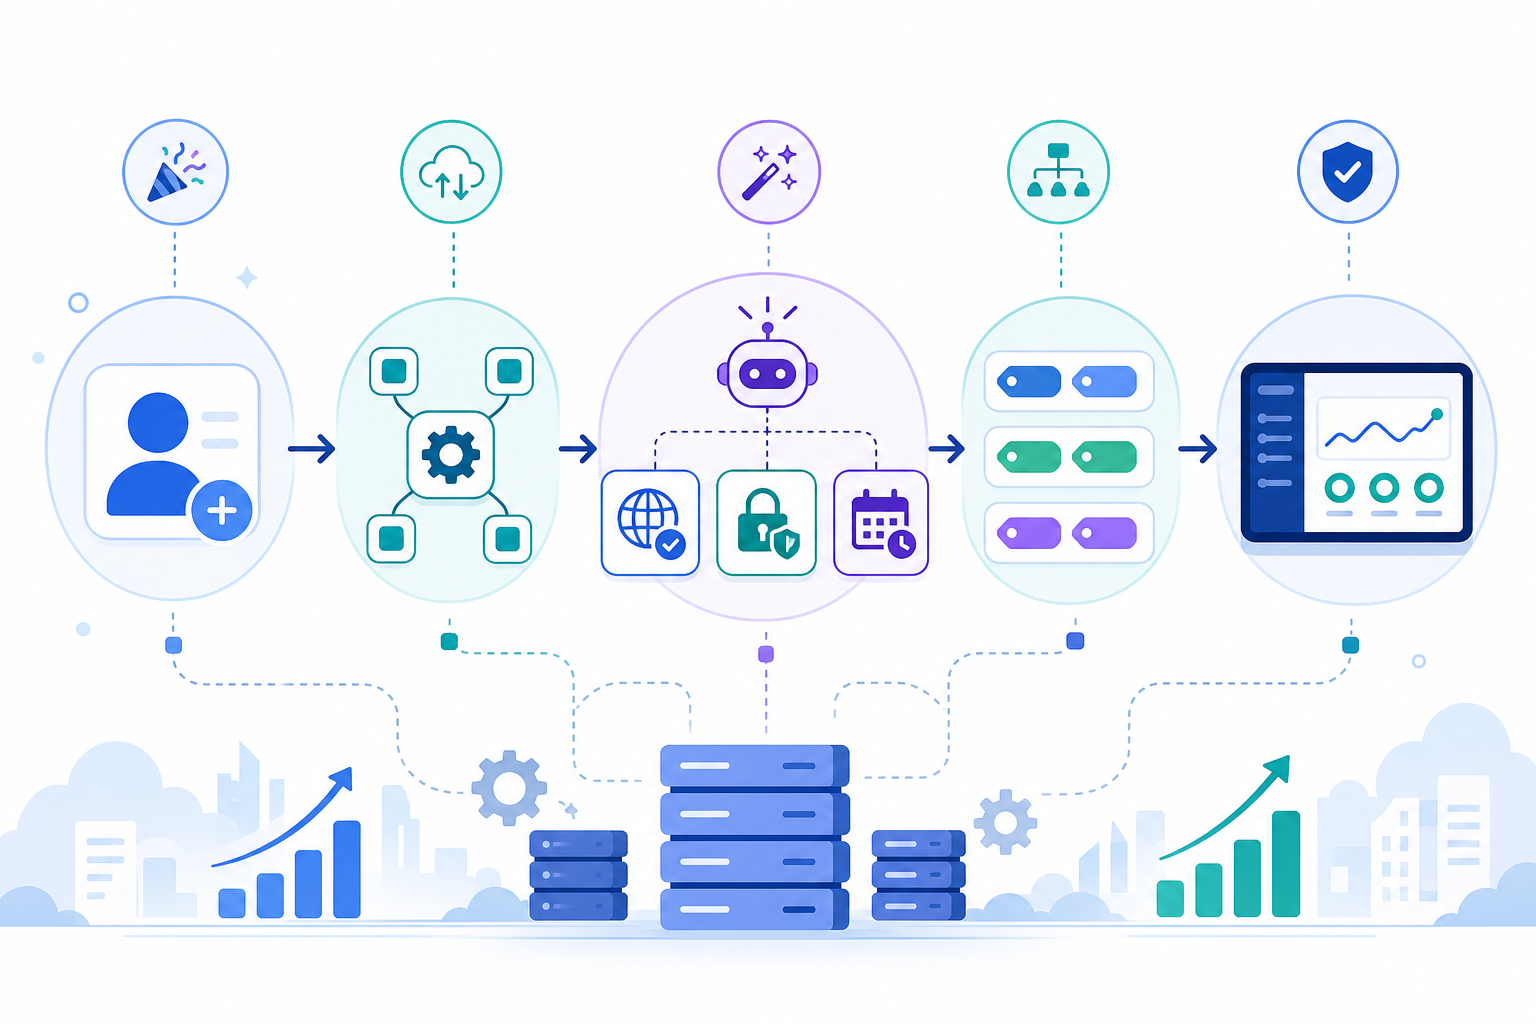
This is where API monitoring setup earns its keep. Here's how I'd walk through building this out:
- Map your client onboarding workflow. Identify the exact point where monitoring setup happens, usually right after a site or API goes live, or when a staging environment is handed off for testing.
- Use the API to spin up standard monitors automatically. Moonitor's API lets you create HTTP, SSL, cron and DNS monitors programmatically, so the moment a new client project kicks off, the right monitors get created without anyone lifting a finger.
- Apply consistent tags and naming conventions in the same API call. This is the step that really pays off. Organisation stops depending on someone remembering the naming rules because they're built directly into the automation.
- Automate status page creation alongside monitor setup. Have the same workflow that creates monitors also spin up a branded status page for the client, so onboarding becomes genuinely hands-off from a monitoring perspective.
- Export monitoring data via API for internal or client reporting. Whether you're feeding uptime statistics into an internal dashboard or a client-facing report, having full API access to your data means you're never locked into one tool's reporting format.
- Test the full flow before rolling it out to real clients. Run through the automation with a dummy client project first, confirming tags, monitor types and status pages all come out exactly as expected.
Once this is running, onboarding a new client's monitoring setup becomes a non-event, something that happens in the background rather than something on your checklist.
How agencies structure monitoring for many clients
After talking with a lot of agencies about this, I keep seeing the same pattern emerge, and it's worth calling out because it works: one monitor group per client, with sub-tags underneath for service type (website, API, cron jobs and SSL certificates). It's simple, but it scales beautifully because it mirrors how agencies actually think about their client relationships.
The real skill is balancing centralisation with transparency. Internally, your team wants one dashboard where everything lives, so nobody has to jump between accounts or tools. Externally, each client wants, and honestly deserves, their own view: a branded status page showing just their uptime, without any hint that you're juggling forty other clients behind the scenes.
Assigning monitor ownership internally matters more than people expect. As your monitor count grows, it's easy for accountability to get diffuse. Everyone assumes someone else is watching a given monitor. Naming an owner for each client's monitoring setup, even informally, keeps that from happening.
One piece that's easy to overlook is cron job monitoring and heartbeat monitoring for scheduled tasks. Agencies managing client backends often have dozens of scheduled jobs running quietly: nightly backups, data syncs and report generation, and these fail silently far more often than websites do. Heartbeat monitoring catches this by expecting a regular "check-in" from the job and alerting you the moment it doesn't show up, which is often the only way you'd know a scheduled task quietly stopped running weeks ago.
Choosing a monitoring plan that scales with your agency
At some point, the maths on per-monitor pricing stops making sense for agencies. If you're calculating your monitor count as websites plus APIs plus SSL checks plus cron jobs plus DNS checks, multiplied by your client count, you'll notice that number climbs fast, often faster than people expect.
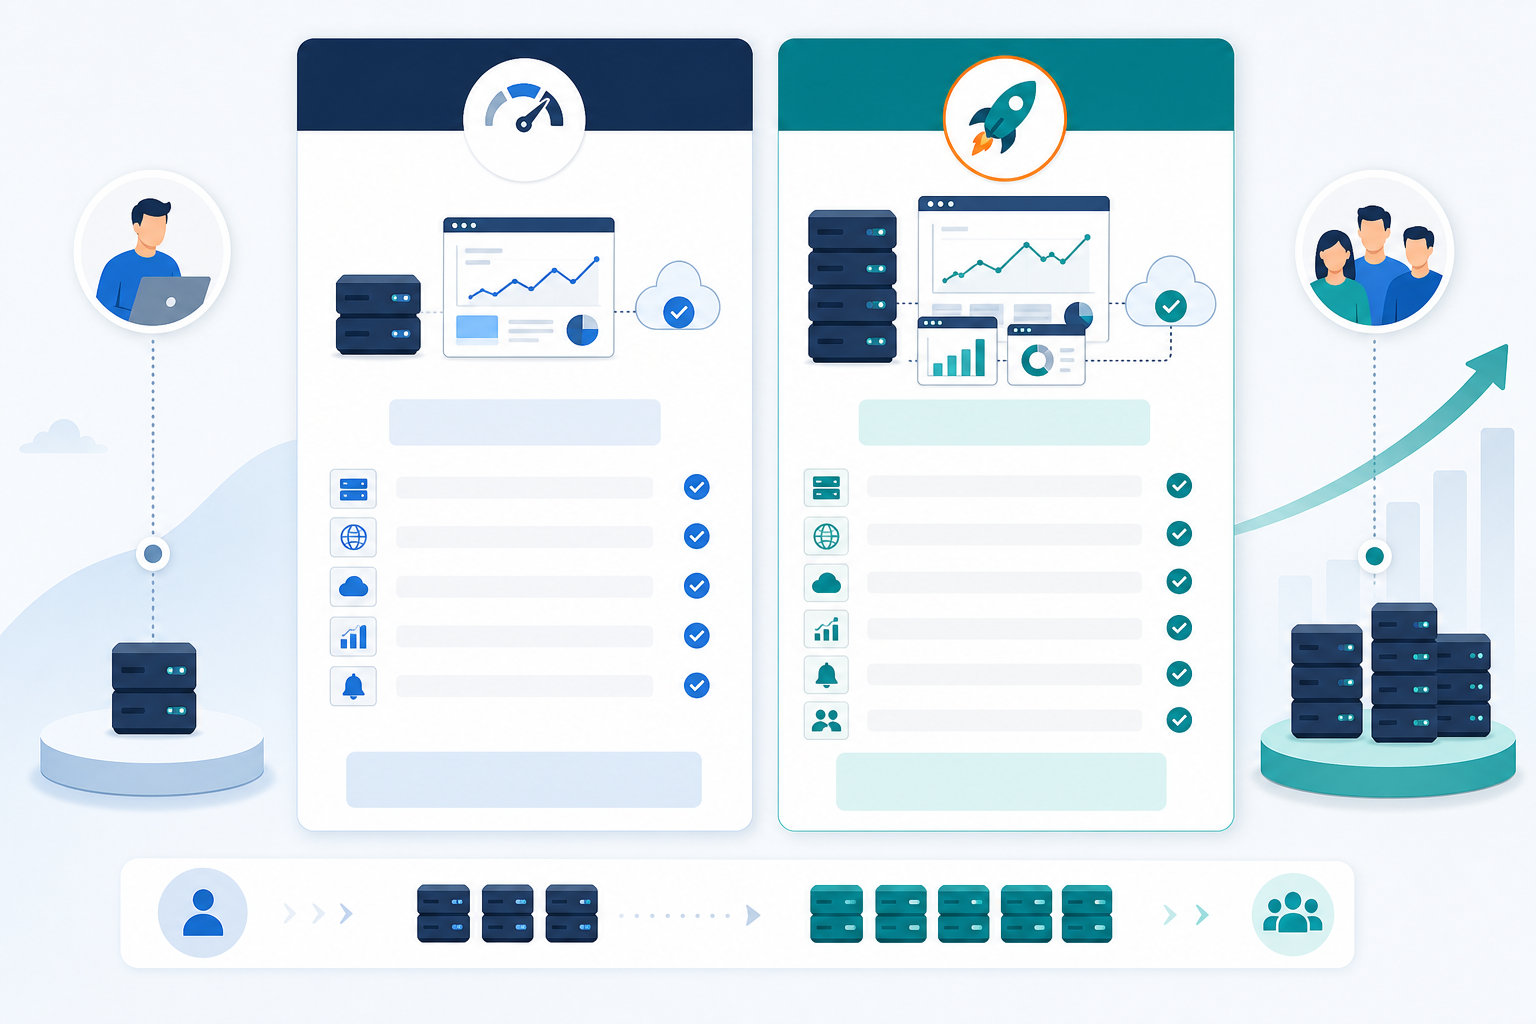
A Solo plan with a monitor cap, like Moonitor's 20-monitor Solo tier at $14/mo, works fine if you've got a handful of steady clients and no immediate growth plans. But agencies onboarding regularly will outgrow that ceiling quickly, sometimes within a single quarter.
| Consideration | Solo Plan (20 monitors, $14/mo) | Max Plan (Unlimited monitors, $49/mo) |
|---|---|---|
| Best for | Small agencies with a handful of steady clients | Growing agencies onboarding regularly |
| Monitor cap | Fixed, can run out fast | None, room to scale without renegotiating |
| Predictability | Costs can jump unexpectedly if you exceed the cap | Flat cost regardless of client growth |
| Planning | Requires tracking monitor count closely | One less thing to track as you scale |
This is really a planning question as much as a pricing one. Nobody wants to hit a plan ceiling mid-quarter, right when you're trying to onboard a new client smoothly. Thinking ahead about your growth trajectory, and choosing unlimited monitors sooner rather than later, saves you from an awkward mid-cycle upgrade scramble.
If you're not sure yet where you'll land, that's exactly what Moonitor's 7-day free trial (no credit card required) is for. Use it to build out your tagging structure, test your API automation and get a real feel for how your monitor count grows before committing to a plan.
Frequently asked questions about monitoring at scale
How do I manage hundreds of monitors without chaos?
The key is structure before scale: use consistent tagging or grouping by client and service type, adopt a naming convention early and rely on a centralised dashboard that lets you filter rather than scroll. Once you're past a few dozen monitors, manual organisation stops working. You need a system that holds up as you add clients.
Should I automate monitor setup with an API?
If you're onboarding clients regularly, yes. Manually creating HTTP, SSL, cron and DNS monitors for every new client is repetitive and error-prone. Using an API to automate monitor creation means every client gets the same consistent setup, tagged correctly, without relying on someone remembering the steps.
How do agencies organise monitoring for many clients?
Most agencies group monitors by client first, then by service type underneath: website, API, cron jobs and SSL certificates. This makes triage fast. When an alert fires, you know immediately whose infrastructure is affected. It also pairs well with branded status pages that give each client visibility into their own uptime without seeing anyone else's data.
What's the difference between a flat monitor list and monitor organisation at scale?
A flat list works fine for 10 to 15 monitors but becomes unmanageable past that. Organised monitoring uses tags, groups or naming conventions so you can filter by client, environment or service instantly, turning a wall of alerts into something your team can act on quickly.
Build a monitoring strategy that scales
At the end of the day, monitoring at scale isn't about a fancier tool. It's about the habits and structure you build around whatever tool you're using. Tag early, automate as soon as it makes sense and design your alerts to protect your team's attention, not just cover every possible failure. Get those three things right, and a hundred monitors will feel just as manageable as ten ever did.