
Uptime Monitoring vs. APM: Which One Does Your Team Actually Need?
Uptime monitoring vs APM: compare external checks, application performance monitoring and response time analytics to build the right monitoring stack.
Uptime Monitoring vs APM: Which Does Your Team Actually Need?
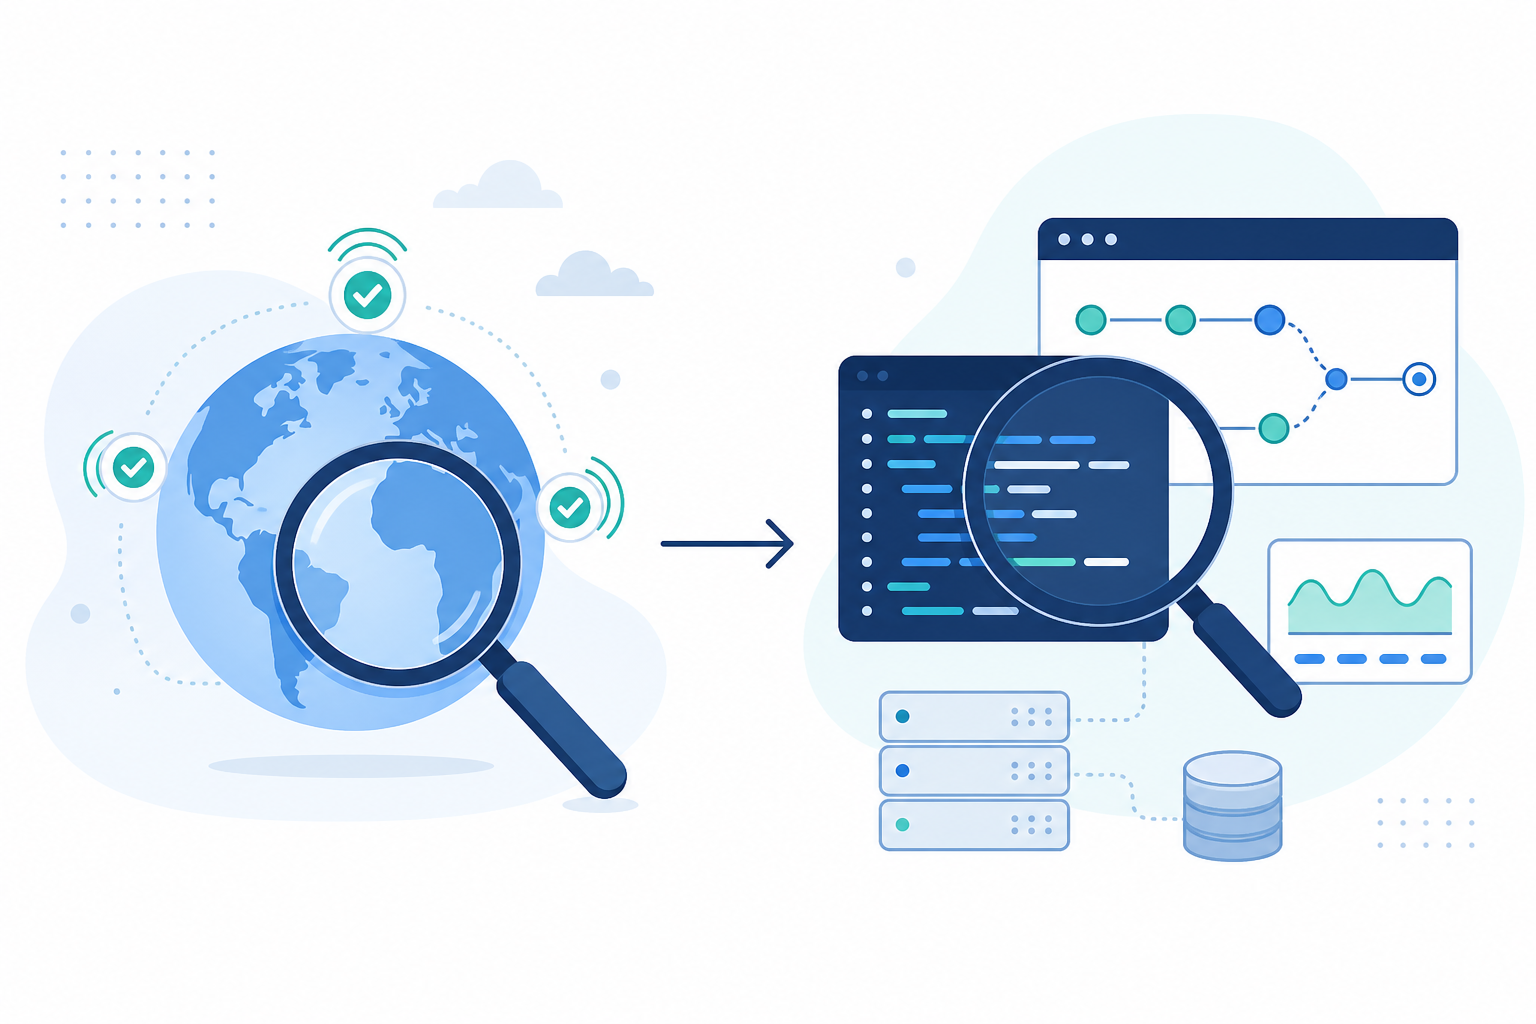
Uptime monitoring tells you whether your service is up and reachable. APM, or application performance monitoring, tells you what's happening inside your code: where time is being spent, and why. Uptime monitoring checks from the outside; APM instruments from the inside. That's really the whole distinction, and it holds up no matter how deep we go into this.
For most teams, this isn't an either/or choice. Start with uptime monitoring as your independent, external check. It's cheap, quick to set up, and it catches outages, expired certificates, and silent job failures that would otherwise blindside you. Add APM once your architecture has enough dependency depth, or your debugging time has gotten expensive enough, that black-box checks stop telling you anything useful. If you're running a handful of services with fairly straightforward incidents, reliable uptime monitoring alone will probably serve you well for a good while yet.
What Is Uptime Monitoring and APM?
I like to think of these as checking your house from the outside versus checking it from the inside. Neither view tells you the whole story on its own.
Uptime monitoring works from the outside, asking one repeated question: is this reachable and behaving as expected? Depending on the tool, that question gets answered through:
- Availability checks: HTTP/S requests, ping, and port checks to confirm a server or endpoint responds correctly.
- Content checks: keyword monitoring, so you know the right content is actually loading, not just a blank page returning a 200 status code.
- Certificate and domain checks: SSL certificate and domain expiry monitoring.
- Scheduled job checks: cron and heartbeat monitoring, so you find out if a job silently stopped firing.
- DNS checks: catching unauthorised or accidental record changes.
- Synthetic transactions: scripted user journeys like "log in, add to basket, check out," which push uptime monitoring closer to simulating real usage than just pinging an endpoint.
APM works from the inside. At its core, it instruments your code: tracing requests through your stack, measuring database query times, tracking error rates by endpoint, and correlating performance shifts with specific deployments. Good APM tooling can baseline normal behaviour and alert when a service drifts from it. That means it can catch some problems before users report them, but only if the service is properly instrumented, the baseline is accurate, and someone's actually watching the alert. It's not automatically comprehensive. It only sees what you've told it to trace, at whatever sampling rate you've configured.
Many APM suites also bundle in infrastructure metrics, logs, and real user monitoring (RUM), but these are related, separate disciplines that vendors package differently:
- Infrastructure monitoring watches servers, containers, and resource usage: CPU, memory, disk. It overlaps with both uptime monitoring and APM depending on the vendor, but it's answering a different question again.
- Distributed tracing and logging often get sold as part of APM suites but can also run as standalone tools.
- Observability is the umbrella term for all of it. Uptime monitoring and APM sit underneath that umbrella as two specific tools, not synonyms for the whole thing.
One line worth holding onto: uptime monitoring answers "is it working?" APM answers "what's happening inside, and why?" Just know that APM's proactive value depends entirely on how well it's set up. A misconfigured APM tool is basically expensive noise.
Uptime Monitoring vs APM: Key Differences in What They Measure
Once you separate the two conceptually, here's how they typically stack up side by side.
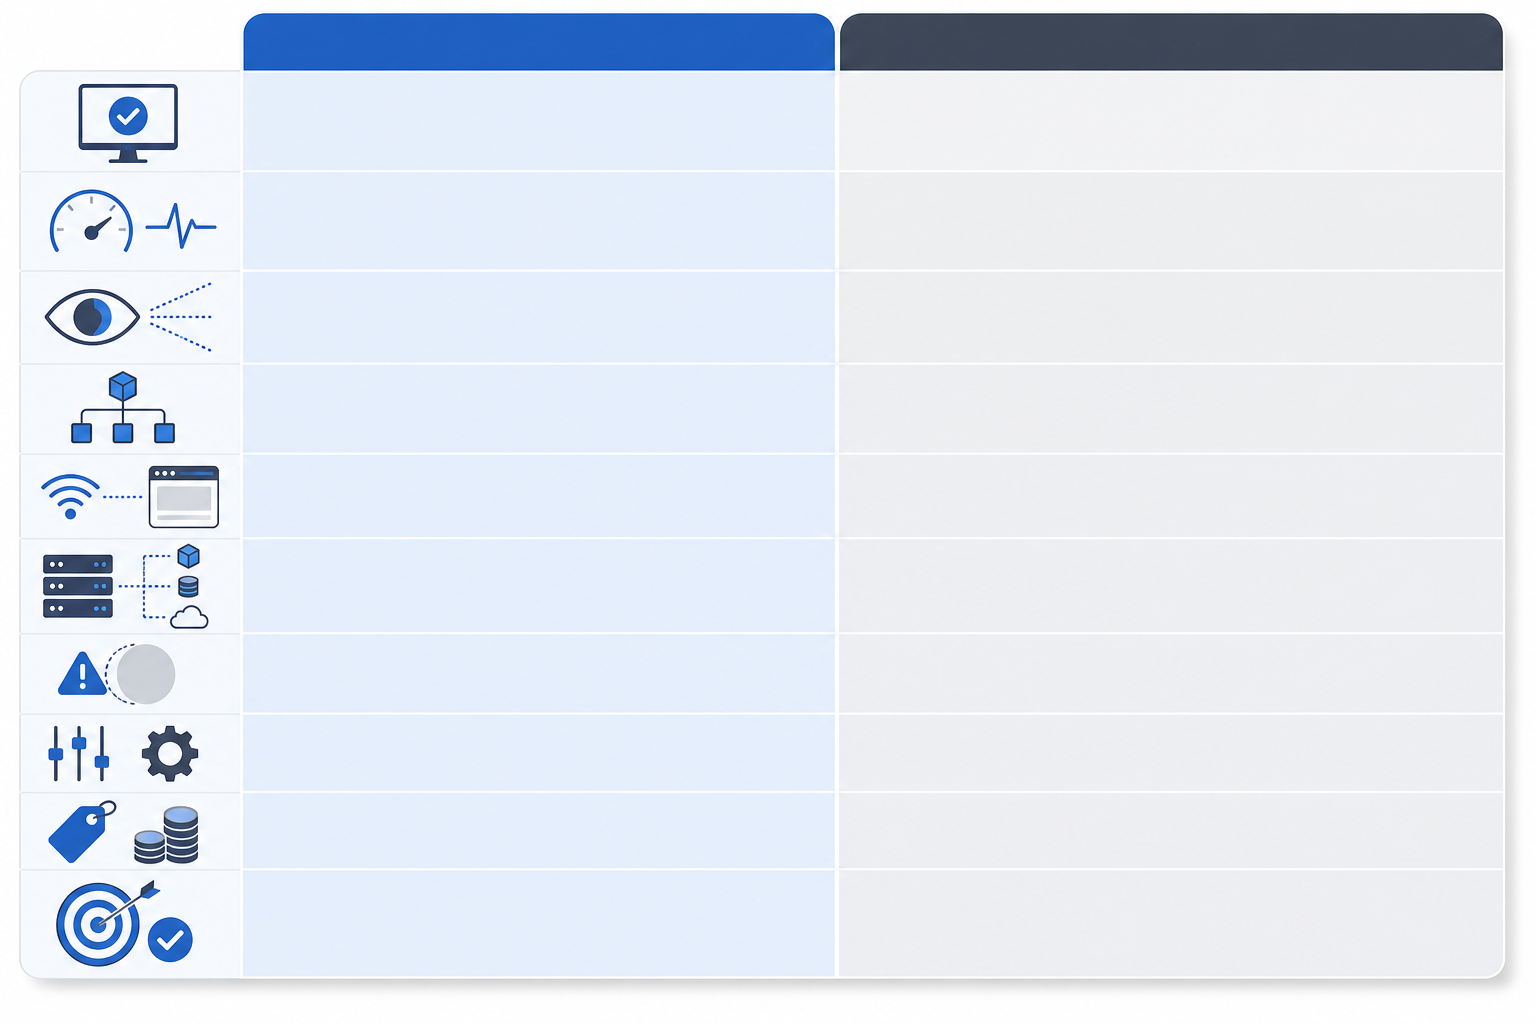
| Uptime Monitoring | APM | |
|---|---|---|
| Primary question | Is it reachable and responding? | Is it healthy internally, and why isn't it? |
| What it measures | Availability, response time from multiple regions, SSL/domain validity, keyword presence, port status, DNS changes, and scheduled job completion | Request traces, code-level performance, database query times, error rates by endpoint, deployment correlation, and, in some tools, resource usage or dependency mapping |
| View type | Black-box (external), sometimes synthetic transactions | White-box (internal, code-level) |
| Typical blind spot | Can't tell you which function or query is slow | Won't catch a lapsed domain, an expired certificate, or a DNS change on its own |
| Setup complexity | Usually minutes, with little to no code changes | Generally needs agents or SDKs, instrumentation, and sampling configuration |
| Typical cost model | Often lower, frequently per-monitor pricing, though this varies by vendor | Often higher, frequently tied to hosts, transactions, or data volume, so check the small print |
| Best use case | Catching outages, expired certificates, and silent failures | Diagnosing performance issues and catching internal degradation early |
Uptime monitoring runs continuously from the outside without touching your codebase, which is exactly why it stays cheap and low-maintenance. APM requires instrumentation and agents living alongside your application, and pricing tends to follow hosts, transactions, or data retention instead. The specifics vary a lot by vendor, so it's worth actually reading the pricing page rather than skimming it.
One thing I'd flag on its own is response time analytics. A decent uptime monitoring tool can show trend lines across regions, flagging degradation, say, response time creeping up by 300ms over a month, well before it turns into an outage or a support ticket.
A Concrete Example: The Slow Checkout
Say you run an e-commerce platform. One morning, your uptime monitor flags something: checkout is still responding, but average response time has jumped from 400ms to 2.1 seconds, confirmed independently from three UK regions. That's uptime monitoring doing exactly its job: telling you, from the outside, that something's genuinely wrong.
Here's where its usefulness runs out, though. It can tell you the request took 2.1 seconds. It can't tell you why. That's where APM earns its keep. Tracing the request, you find it passes through an API gateway, the checkout service, a stock-level database query, and a third-party payment call. The trace shows 1.8 seconds sitting in one unindexed database query. The gateway and payment provider are both fine.
In this case, one trace was enough to find the culprit. Real incidents aren't always this clean, and you'll often need to correlate the trace with deployment history, database metrics, and infrastructure logs before the picture clears up. Even then, APM narrows the search dramatically compared with guessing. Here, the fix was simple: add an index, and checkout is back to 400ms within the hour. Uptime monitoring told you something was wrong. APM told you where to look.
When Is Uptime Monitoring Enough?
Before going further, be honest about how critical the service actually is. A marketing site that costs a few worried Slack messages if it's down for ten minutes has very different needs from a payment system where every minute costs real money. With that said, plenty of teams are genuinely well served by uptime monitoring alone. You're probably in this camp if:
- You're running a small number of services and mainly need to know the instant something goes down, not the exact line of code responsible.
- Your team doesn't have the bandwidth to manage APM agents, sampling rates, and trace retention on top of everything else already on the plate.
- You care about availability and response-time trends, not granular code-level diagnostics that need a dedicated person to interpret.
- You need to catch silent failures: an expiring SSL certificate, a lapsed domain, or a cron job that quietly stopped three days ago. None of that shows up in application logs, but it'll take down an otherwise healthy service just the same.
- Budget matters, and low-noise, reliable alerting beats a heavier monitoring platform with a steep learning curve nobody has time for.
One caveat worth saying plainly: a basic HTTP check confirms a page loaded, not that it works. If login, checkout, or API authentication are critical journeys, add synthetic transactions or RUM to your uptime monitoring layer. A 200 status code doesn't mean a customer can actually complete the task they came to do.
Quick self-check: if your incidents mostly sound like "something's down, we restart it, it's fine" rather than "something's up but behaving strangely and we can't tell why," and the service isn't mission-critical, uptime monitoring alone is probably still doing its job.
When Do You Need Full APM?
On the flip side, there's a point where uptime monitoring genuinely stops being enough. I'd look at these signals together rather than ticking them off against some magic number:
- Real dependency depth. If a slow request could plausibly be caused by several interdependent services, a gateway, an auth layer, a database, a third-party integration, then "it's up" stops telling you anything useful.
- Recurring incidents with no clear cause. Uptime checks say everything's fine, but users report slowness you can't reproduce from logs alone.
- You need to trace requests across services to find exactly where latency gets introduced, instead of guessing.
- You have SLAs or SLOs tied to application performance, something like "95% of requests under 300ms," not just raw availability.
- Engineers are losing real hours to performance debugging with logs and guesswork, and that cost now outweighs the effort of adopting a proper tool.
- You need per-user or per-transaction visibility, for example, understanding why performance degrades for one customer segment but not others.
- You want to catch problems before they're reported, using baseline anomaly detection and deployment correlation.
Before adopting APM, it's worth weighing the trade-offs too. Instrumentation needs upkeep as your codebase changes. Trace and log volume gets expensive fast, especially at high traffic. Traces can also capture sensitive request data, user IDs, query parameters, sometimes payloads, so you'll need sampling and redaction rules in place, particularly if you handle personal data. And honestly, APM only helps if someone's tuning the alerts and has time to act on them. A tool nobody looks at is just another line item.
There's no fixed number of the above that flips a switch to "now." What matters is whether your team can currently act on the answer. If you're spending real engineering hours each month trying to reconstruct what a distributed system did, that's a stronger signal than any checklist could give you.
How to Build a Layered Monitoring Stack
So how do you actually put this into practice? I think of it as three tiers of capability, detection, response, and diagnosis, rather than a ladder every team has to climb in the same order.
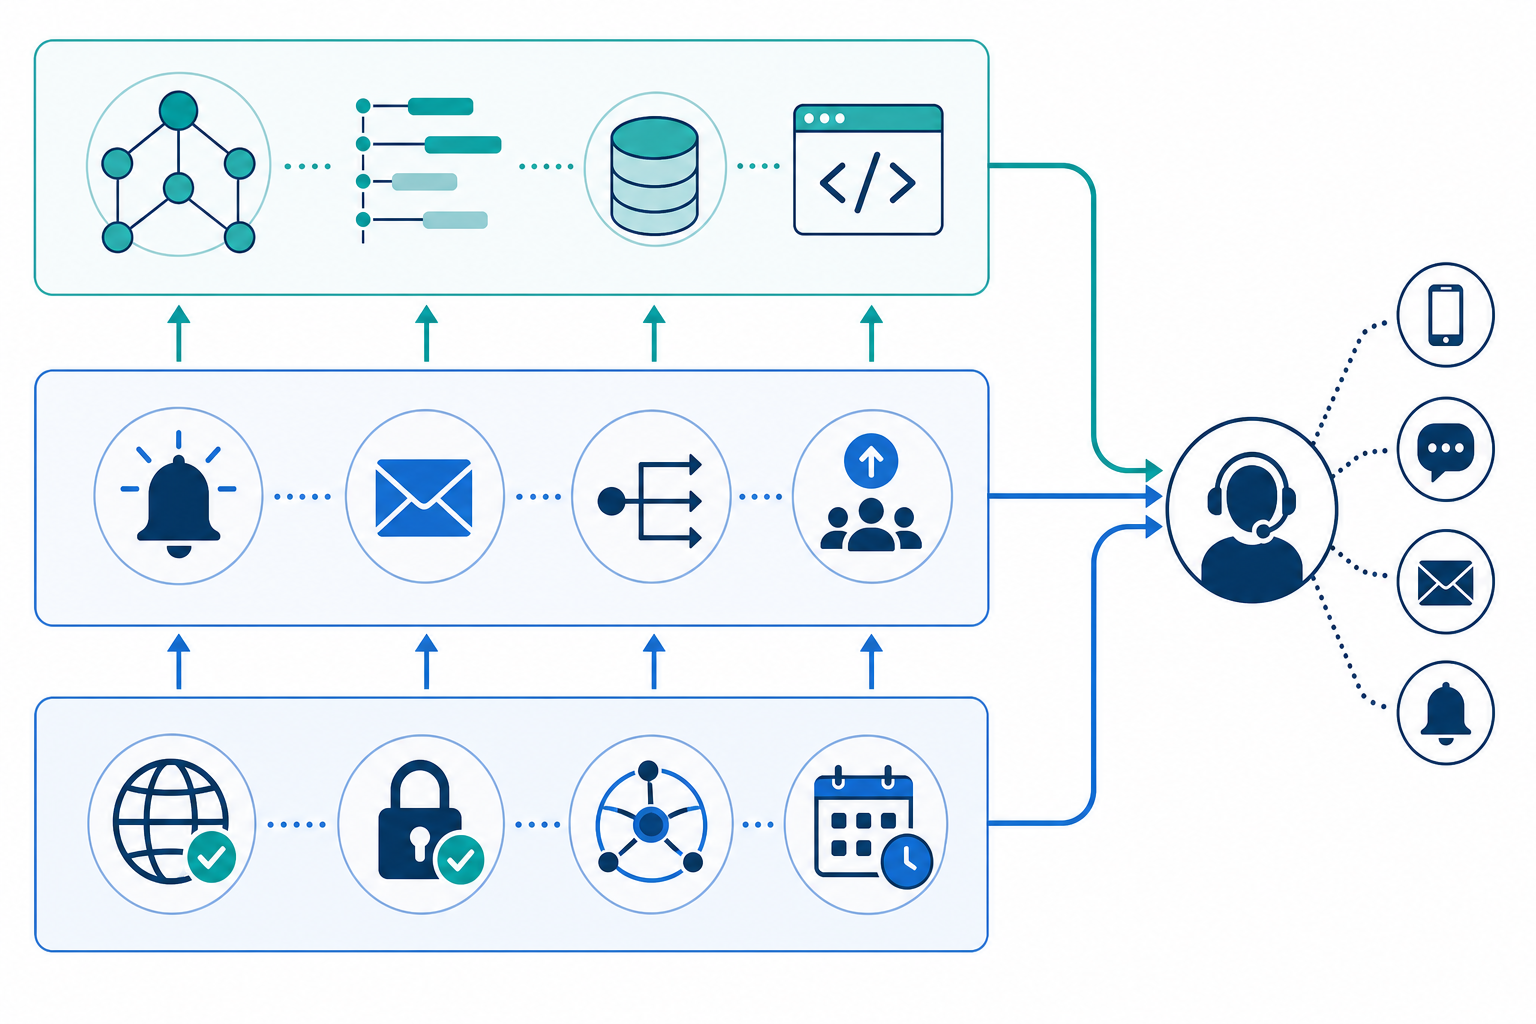
Tier 1, Detection (minimum viable, for every service that matters):
- Uptime monitoring: HTTP/S checks, keyword checks, port and ping monitoring, and heartbeat monitoring for cron jobs.
- SSL certificate and domain expiry monitoring, with alerts weeks in advance.
- DNS monitoring, to catch unauthorised or accidental record changes before they cause an outage.
- Infrastructure monitoring for servers, containers, and key resource metrics where relevant.
Tier 2, Response (build alongside detection, not after it):
- Incident alerting via Slack, Discord, Telegram, email, or webhooks. Look for multi-region verification specifically here, so a single flaky network path doesn't page your on-call engineer at 3am for something that isn't actually broken.
- One shared on-call workflow, so uptime alerts and, eventually, APM alerts feed into a single process rather than two competing ones. Design for this before APM arrives, not after.
Tier 3, Diagnosis (add selectively, service by service, once the first two tiers are solid):
- Response time analytics and incident history, to spot the slow creep, a service that's technically "up" but getting a little slower every week.
- APM, introduced once you've genuinely outgrown black-box visibility, for the specific services where code-level tracing would actually change what you do next. Not every service needs it, even once you've adopted it elsewhere.
Honestly, skipping the response tier until APM shows up is one of the most common ways teams accidentally double their own alert fatigue. Two tools, two alert streams, no shared process, and everyone's more tired for it.
A Note for UK Teams
A few UK-specific factors shape this decision beyond general architecture. If you're supporting FCA-regulated fintech, NHS-adjacent healthcare, or public sector contracts, uptime SLAs and incident communication are often written into the contract itself rather than being a nice-to-have. That makes an external status page and independent uptime verification closer to a compliance requirement than a convenience.
Probe location and data residency are two separate questions, and it's worth not lumping them together. Probe location is about where your uptime checks originate. UK or EU regions specifically, rather than a global average, matter if you want to measure real latency for UK customers. Data residency is about where the collected telemetry, logs, or traces actually get stored and processed, which matters for GDPR compliance and any data-processing agreements you've signed. Confirm both, separately, with any tool you're evaluating, uptime monitoring or APM, rather than assuming one implies the other.
If you're procuring monitoring or APM tools for a regulated environment, check that your data processing agreement covers subprocessors, and ask specifically whether trace or log data could include personal data captured incidentally through request parameters. It's a much smaller conversation to have upfront than to have after an incident.
Uptime Monitoring vs APM: Decision Matrix
Rather than restating the whole article, here's a compact way to work out where you sit right now.
| Your situation | What to reach for | What to do next |
|---|---|---|
| Small number of services, incidents are mostly "it's down, we restart it, it's fine" | Uptime monitoring alone | Set up HTTP/S, SSL, DNS, and cron checks; add a status page if you communicate with external clients |
| Growing service count, occasional unexplained slowness, no latency SLAs yet | Uptime monitoring now, start evaluating APM | Add response time analytics and incident history; trial an APM tool on your highest-traffic service |
| Multi-service architecture, recurring unexplained incidents, latency SLAs, or engineers losing real hours to debugging | Both, treated as complementary from the start | Keep uptime monitoring as your independent external check; instrument critical services with APM; build one shared on-call workflow |
The Bottom Line
If there's one thing to take away, it's this: start every service that matters with an independent, external uptime check. It's cheap, it's fast, and it catches failures, expired certificates, lapsed domains, silently stopped cron jobs, that won't show up anywhere else. Add APM when dependency depth, recurring unexplained incidents, or the cost of debugging time genuinely justifies it. And keep the uptime layer running even after you do, because APM won't catch a DNS misconfiguration or a certificate that's about to expire. Different jobs, both still worth doing.
A quick way to check where you stand:
- Can you currently explain your last three incidents using logs and uptime data alone? If yes, you're probably fine without APM for now.
- Would tracing a single request across your services meaningfully change what you'd do next? If yes, that's your signal to start evaluating APM, for the specific services where it matters, not your whole stack at once.
- Do you have the headcount to tune alerts and act on what APM tells you? If not, fix that first. An unwatched dashboard doesn't help anyone, no matter how good the data underneath it is.
Most teams don't need to pick a side here. They just need to figure out which layer of their monitoring stack they're currently missing.
Example: Where a Tool Like Moonitor Fits
Disclosure: Moonitor is our own product, so treat this as one example of the uptime layer described above, not a neutral recommendation.
Moonitor sits in the uptime and infrastructure detection tier: HTTP/S, keyword, port, ping, SSL, domain, cron/heartbeat, and DNS checks, with multi-region failure verification so a single data-centre blip doesn't trigger a false alert. It ships with an API and data export, built to sit alongside whatever APM tool you eventually adopt rather than lock you into one ecosystem. Worth being upfront about what it isn't, too: it doesn't do distributed tracing, code-level profiling, or application-level diagnostics. That's APM's job, not ours. For exact setup steps, monitor types, or current trial terms, our own site is the accurate source rather than this article, since those details can change.
FAQ: Uptime Monitoring vs APM
Is uptime monitoring the same as APM?
No. The difference is direction of view. Uptime monitoring checks your service from the outside: whether it's reachable, responding, and within an expected time, sometimes through synthetic transactions. APM instruments your code from the inside, tracing requests and measuring performance at code level. They're complementary, not substitutes for each other.
Do I need both uptime monitoring and APM?
It depends on scale, criticality, and whether your team can actually act on what APM tells you. Small teams running a handful of services, especially lower-criticality ones, often get by comfortably with uptime monitoring plus SSL, DNS, and cron checks. Larger or more dependency-heavy architectures typically benefit from adding APM on top.
What does APM measure that uptime monitoring doesn't?
Depending on instrumentation, APM can measure request traces across services, database query times, error rates by endpoint, and deployment-correlated performance changes. Uptime monitoring can tell you a request took 2.1 seconds. APM, properly configured, can tell you which specific query or hop caused it.
How is synthetic monitoring different from APM?
Synthetic monitoring scripts a user journey, log in, add to basket, check out, and runs it externally on a schedule to catch broken workflows before real users do. It's still black-box: it tells you a journey failed, not why. APM can then trace that same journey internally to find the cause.
Can I start with uptime monitoring and add APM later?
Yes, and honestly it's the most common path. Start with reliable uptime, SSL, DNS, and cron monitoring, then add APM once you hit performance issues or SLA requirements that black-box checks can't address. There's no penalty for adding APM in year two instead of month one.
Can uptime monitoring replace APM for a microservices application?
Usually not on its own, though it stays useful as an independent check even after APM is in place. Uptime checks confirm each service is reachable, but they won't show how a request behaves as it crosses several services, or which hop is adding the latency. Distributed tracing from APM is generally what closes that gap.