
Webhook Alerts for Monitoring: A Developer's Guide to Routing Uptime Alerts Into Your Own Systems
Learn how webhook alerts and a monitoring API send real-time incidents to your systems, automate response, and secure endpoints beyond Slack notifications.
Webhook alerts push real-time monitoring events straight to an endpoint you control, so your systems can act on downtime instantly instead of waiting for someone to read a Slack message.
If you've ever received a Slack ping at 2am about a downed API and thought, "great, now I have to manually open a ticket, restart the service, and update the status page myself" — you already understand the problem webhooks solve. Instead of a notification that just sits there waiting for a human, a webhook lets your monitoring platform send structured data directly to an endpoint you own, triggering automated workflows the moment something changes. With Moonitor, that means check failures, SSL expiry warnings, and missed cron jobs can land in your incident system, custom dashboard, or internal API within seconds — no polling required.
That's the short version. But if you're the person actually wiring this up, you want to know what the payload looks like, how to secure the endpoint properly, and what to do when a delivery silently fails at the worst possible moment. So let's get into it — with actual code, not just concepts.
Why Webhook Alerts Beat Generic Monitoring Notifications
Email and Slack alerts are wonderful — for humans. They're readable, they show up on your phone, and they don't require you to write a single line of code. But here's the catch: a human still has to do something with that information. Someone has to read the message, decide it's real, open a ticket, and maybe ping the on-call engineer. That's fine at 2pm on a Tuesday. It's a lot less fine at 2am when nobody's watching the channel — and if your team runs UK hours with on-call cover overnight, you know exactly how thin that coverage can get.
Webhooks skip the human-in-the-loop step. Instead of "hey, something's wrong," you get structured JSON your systems can parse and act on immediately. That single difference opens a lot of doors:
- Auto-create a ticket in Jira or Linear the moment a check fails
- Trigger a runbook or remediation script without anyone touching a keyboard
- Feed a custom internal dashboard that sits alongside your public status page
- Log every alert for later analysis, without depending on email search
This becomes especially valuable once you're running more than a handful of checks. If you're doing HTTP/S, port, SSL, DNS, and cron job monitoring across dozens of services, a single Slack channel turns into noise fast. Webhooks let you route different alert types to different systems — SSL expiry warnings to your certificate renewal pipeline, cron job failures to your ops dashboard, and DNS changes to a security review queue — without anyone triaging manually. The monitoring API rounds this out nicely too, since it lets you pull historical context the moment a webhook fires, rather than relying on the alert alone.
What Does a Monitoring Webhook Payload Look Like?
Once you've decided webhooks are the way to go, the next question is: what actually shows up in that POST request? A quick disclaimer first — the example below shows the shape of a typical monitoring webhook payload, not a frozen specification. Field names, exact types, and available metadata vary between providers and can change over time, so always check your monitoring platform's current documentation before you build a parser against it.
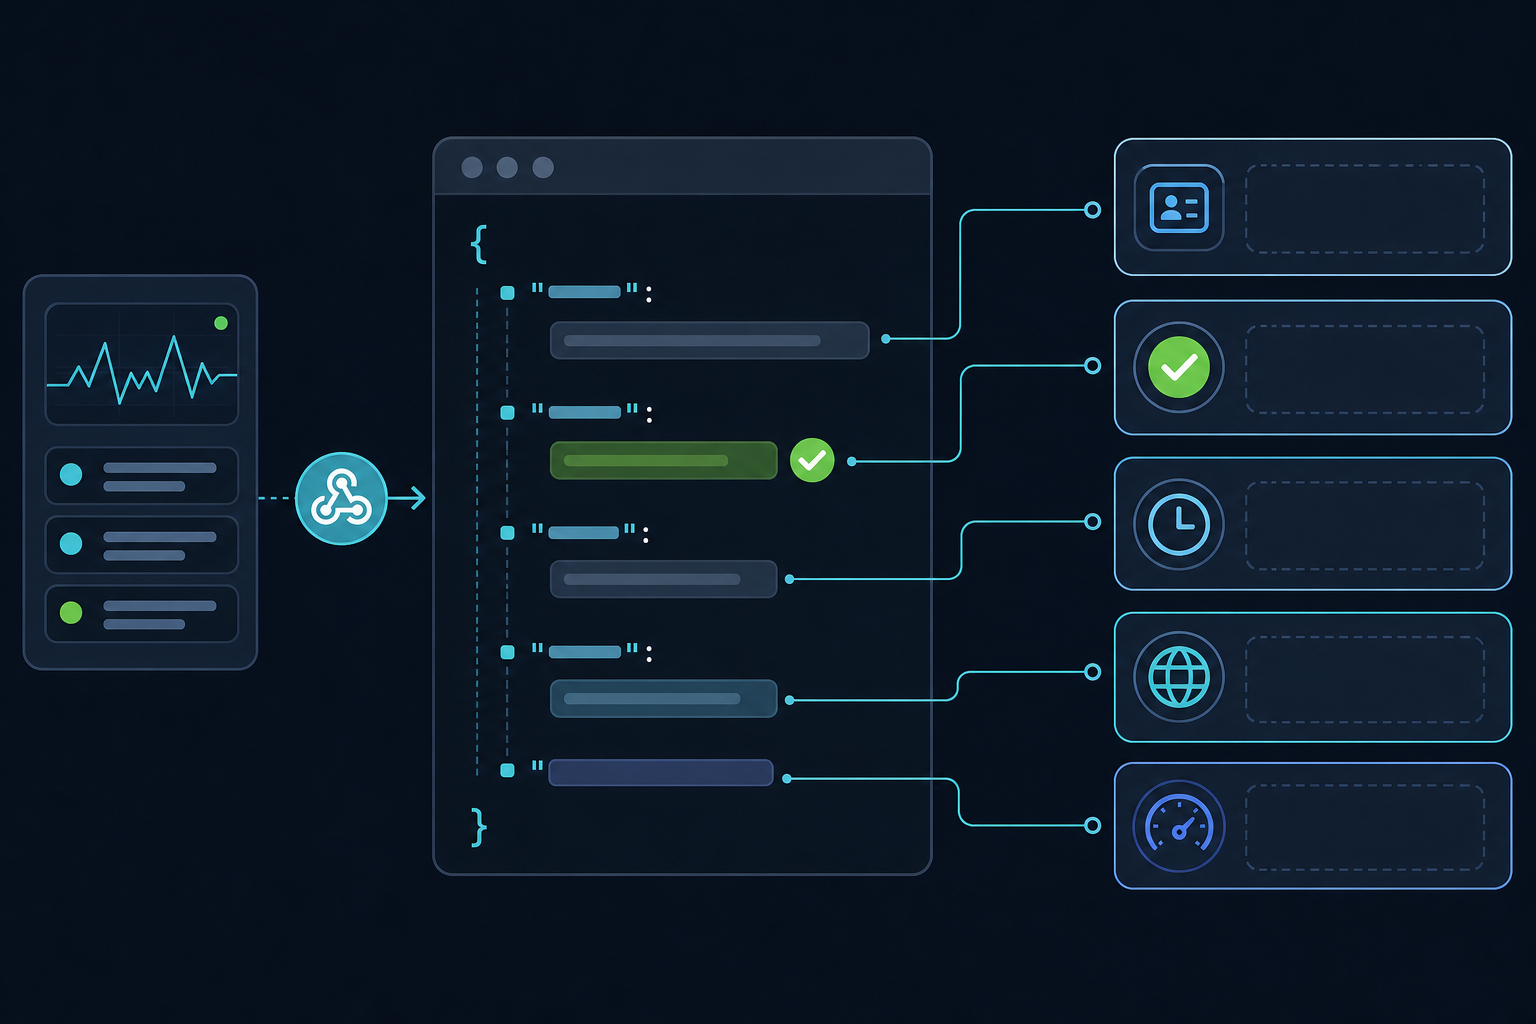
Most mature monitoring platforms structure payloads around two ideas — an event envelope (metadata about the alert itself) and an incident payload (details about what actually happened). A generic example typically includes something like:
- Monitor ID — a stable identifier that shouldn't change even if you rename the monitor later
- Monitor type — HTTP, keyword, port, ping, SSL, cron/heartbeat, or DNS
- Status change — up, down, or recovered
- Timestamp — when the state change was recorded, usually in UTC (worth remembering if your team works in BST — build your dashboards to convert, not to assume)
- Verifying region(s) — which region(s) confirmed the failure, if your plan includes multi-region verification
- Response time — how long the check took before it failed or recovered
- Error message — the specific reason the check failed, such as a timeout or a non-200 response code
Here's an illustrative “down” alert — again, treat this as a generic example rather than an exact Moonitor schema:
{
 "event_id": "evt_8f2ab1",
 "monitor_id": "mon_7c19",
 "monitor_type": "http",
 "status": "down",
 "timestamp": "2025-01-15T10:00:02Z",
 "verified_regions": ["eu-west", "us-east"],
 "response_time_ms": null,
 "error": "Connection timed out after 10000ms"
}
And a matching recovery event:
{
 "event_id": "evt_8f2ab2",
 "monitor_id": "mon_7c19",
 "monitor_type": "http",
 "status": "up",
 "timestamp": "2025-01-15T10:04:47Z",
 "response_time_ms": 312,
 "error": null
}
If your platform supports multi-region failure verification, you'll often see a verified_regions field on the down event — that's designed to stop a single flaky probe from paging someone over a network blip. The exact confirmation logic (how many regions and how much delay) varies by provider and plan, so it's worth confirming in your dashboard settings rather than assuming.
One genuinely useful thing to look for is whether the payload structure stays consistent across monitor types. Whether it's an SSL certificate nearing expiry or a cron job that missed its heartbeat, if the same envelope fields show up in the same places across HTTP, keyword, port, ping, SSL, cron/heartbeat, and DNS checks, you can write one parsing function instead of seven. That consistency — when it holds — saves you a genuinely annoying amount of future debugging. Just confirm it holds for your specific setup before you build around the assumption.
How to Set Up Your First Monitoring Webhook
Getting a webhook running usually takes less time than reading this section. I'll break it into four stages so it's easier to follow along.
1. Create the endpoint. Stand up something that accepts POST requests — a serverless function, a route on your existing API, or a temporary tool such as a request-inspecting webhook site while you're testing. Here's a minimal example in Node.js/Express that verifies a signature, deduplicates by event ID, and responds quickly:
const crypto = require('crypto');

function verifySignature(rawBody, signatureHeader, secret) {
  const expected = crypto
    .createHmac('sha256', secret)
    .update(rawBody)
    .digest('hex');
  return crypto.timingSafeEqual(
    Buffer.from(expected),
    Buffer.from(signatureHeader || '', 'utf8')
  );
}

app.post('/webhooks/monitoring', express.raw({ type: 'application/json' }), async (req, res) => {
  const signatureHeader = req.headers['x-webhook-signature']; // confirm the actual header name in your platform's docs

  if (!signatureHeader || !verifySignature(req.body, signatureHeader, process.env.WEBHOOK_SECRET)) {
    return res.status(401).send('invalid signature');
  }

  const payload = JSON.parse(req.body);

  if (await alreadyProcessed(payload.event_id)) {
    return res.status(200).send('duplicate, ignored'); // idempotency check
  }

  await markProcessed(payload.event_id);
  res.status(200).send('ok'); // acknowledge quickly, then do the heavy lifting

  enqueueForProcessing(payload);
});
Note: confirm the exact signature header name, hashing algorithm, and any timestamp tolerance your platform uses before relying on this in production — treat the above as a starting pattern, not a guaranteed specification.
2. Configure Moonitor. Add the webhook URL in your alert settings. You can use it alongside email, Slack, Discord, or Telegram, or as your only channel — that's entirely up to how your team works. Choose which monitors and status changes trigger it; you might only want webhooks for production API monitoring, while development environment checks stay on Slack.
3. Test the delivery. Send a test alert from your dashboard, or simulate one yourself with curl while you're building:
curl -X POST https://your-endpoint.example.com/webhooks/monitoring \
  -H "Content-Type: application/json" \
  -H "X-Webhook-Signature: <test-signature>" \
  -d '{"event_id":"evt_test123","monitor_id":"mon_test","status":"down"}'
This confirms your field names match what you expected and that your parser doesn't choke on unexpected data.
4. Make processing reliable. Confirm your endpoint returns a 2xx response quickly — within a few seconds is a safe target, though check your platform's documentation for the exact timeout it enforces. If your endpoint doesn't respond in time, most platforms will treat the delivery as failed and may retry, which is exactly why the idempotency check above matters: you want duplicate deliveries to be harmless, not disruptive.
This last step trips people up more than you'd think. It's easy to build an endpoint that processes the alert perfectly but forgets to send back a 2xx status code because it's busy doing asynchronous work first. Return the response quickly, then handle the heavy lifting afterwards — that's what the queue call in the code above is doing.
How to Route Webhook Alerts to Internal Tools
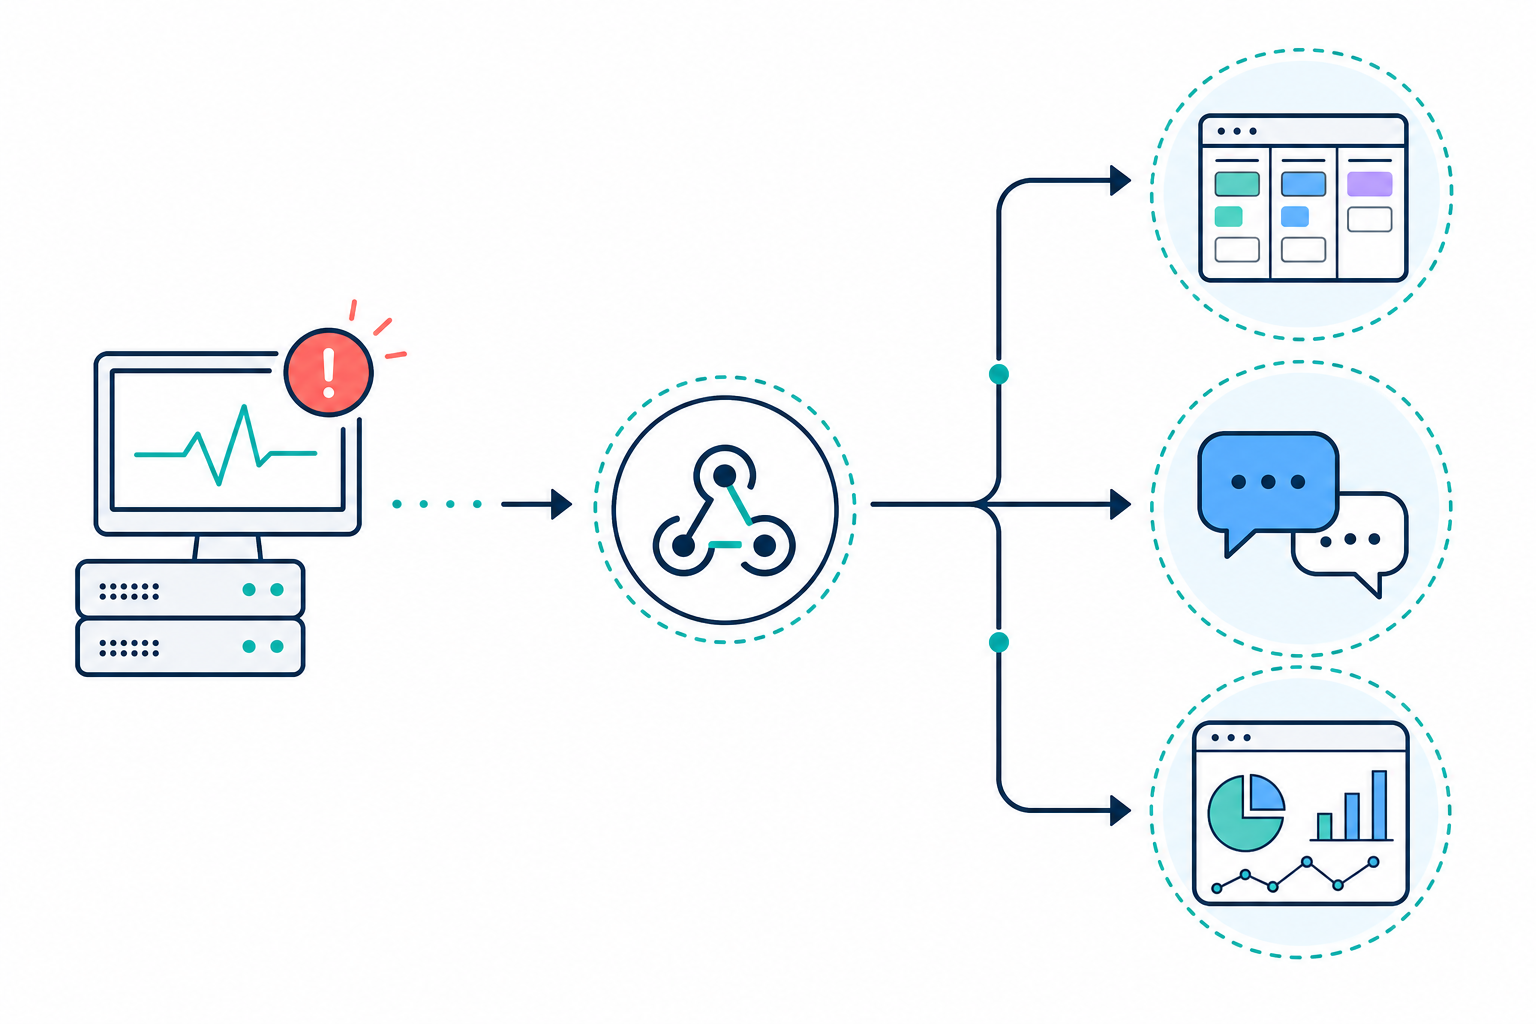
This is where webhooks stop being a notification mechanism and start being infrastructure. Once alerts are structured JSON hitting an endpoint you control, you can route them almost anywhere:
- Auto-create tickets in Jira or Linear the second a check fails, complete with the error message and affected service pre-filled
- Feed a custom internal dashboard that sits next to your public status page, giving your team a more detailed view than customers see
- Trigger remediation scripts for known failure patterns — for example, automatically restarting a service after a missed heartbeat check, before a human even notices
- Log every alert into a data warehouse for later incident review, response-time trend analysis, or postmortem writing
- Enrich alerts with historical context by combining the webhook payload with a call to the monitoring API, so your ticket doesn't just say “API is down” — it says “API is down, and this is the third time this week, with an average recovery time of four minutes”
That last pattern — webhook plus API lookup — is genuinely one of the most useful things you can build. The webhook tells you what just happened. The API tells you what usually happens. Together, they give whoever's on call enough context to make a decision in seconds instead of digging through a dashboard.
How to Secure a Webhook Endpoint
Here's the part people skip until something goes wrong. A webhook endpoint is, by definition, a public-facing URL that accepts incoming data and often triggers automated actions. That's exactly the kind of thing you want to lock down properly — and if your payloads ever touch anything resembling personal or customer data, it's worth thinking about this through a UK GDPR lens too: know where that data is logged, how long you retain it, and who can access it.
- Always use HTTPS. Never accept alert traffic over plain HTTP — TLS protects the payload in transit, full stop.
- Verify payload authenticity with a shared secret or HMAC signature, as shown in the code earlier. This is non-negotiable if your webhook triggers anything more consequential than a log entry. Verify the signature against the exact raw request body, before any JSON parsing happens — reformatting the body even slightly can break signature checks. If your platform includes a timestamp in the signed payload, check it's recent too; that protects against a captured request being replayed later.
- Restrict source IPs where feasible, but don't rely on this as your only defence. IP ranges change, and an allowlist doesn't prove a specific payload was authorised — think of it as an extra layer, not the lock itself.
- Validate and rate-limit incoming payloads before processing them. Treat every webhook body as untrusted input, even after signature verification. Cap payload size, reject anything malformed, and never pass alert fields directly into shell commands, database queries, or internal URLs without validation.
- Rotate secrets periodically, especially after team changes or when you swap integrations. Good practice is to accept both the old and new secret briefly during rotation, so nothing breaks mid-transition. Store secrets in a proper secrets manager rather than plain environment files where you can help it.
One subtlety worth internalising: webhook delivery from most platforms is generally at-least-once, not exactly-once — meaning duplicate deliveries can and do happen, often from a temporary network blip on either end triggering a retry. That's exactly why the event_id deduplication check in the earlier code sample matters. Store the event ID and check for duplicates before you trigger anything irreversible, such as opening a second ticket for the same incident or restarting a service that's already mid-restart. If you're unsure of your platform's exact retry count or backoff schedule, that's worth confirming in the documentation — build your idempotency handling to be safe regardless.
How to Debug Failed Webhook Deliveries
Even a well-built webhook setup will occasionally hiccup, so it helps to have a debugging routine ready before you need it. Here's a quick symptom-to-cause table I keep coming back to:
| Symptom | Likely cause | What to check |
|---|---|---|
| No request ever arrives | Wrong URL configured, DNS issue, or firewall blocking inbound traffic | Confirm the URL in your alert settings; check firewall/WAF logs for blocked requests |
| 401/403 response | Signature mismatch, rotated secret, or signing against parsed rather than raw body | Compare the raw request body against what you're hashing; confirm the secret matches what's configured |
| Timeout (408/504) | Endpoint doing synchronous heavy work before responding | Move processing to a queue and return a 2xx immediately, as shown earlier |
| 429 rate limited | Retry storm hitting a rate-limited endpoint | Check for repeated retries and add backoff handling on your side |
| Same event processed twice | Missing idempotency check | Confirm you're storing and checking event_id before side effects |
Beyond that table, it's worth building this into a habit:
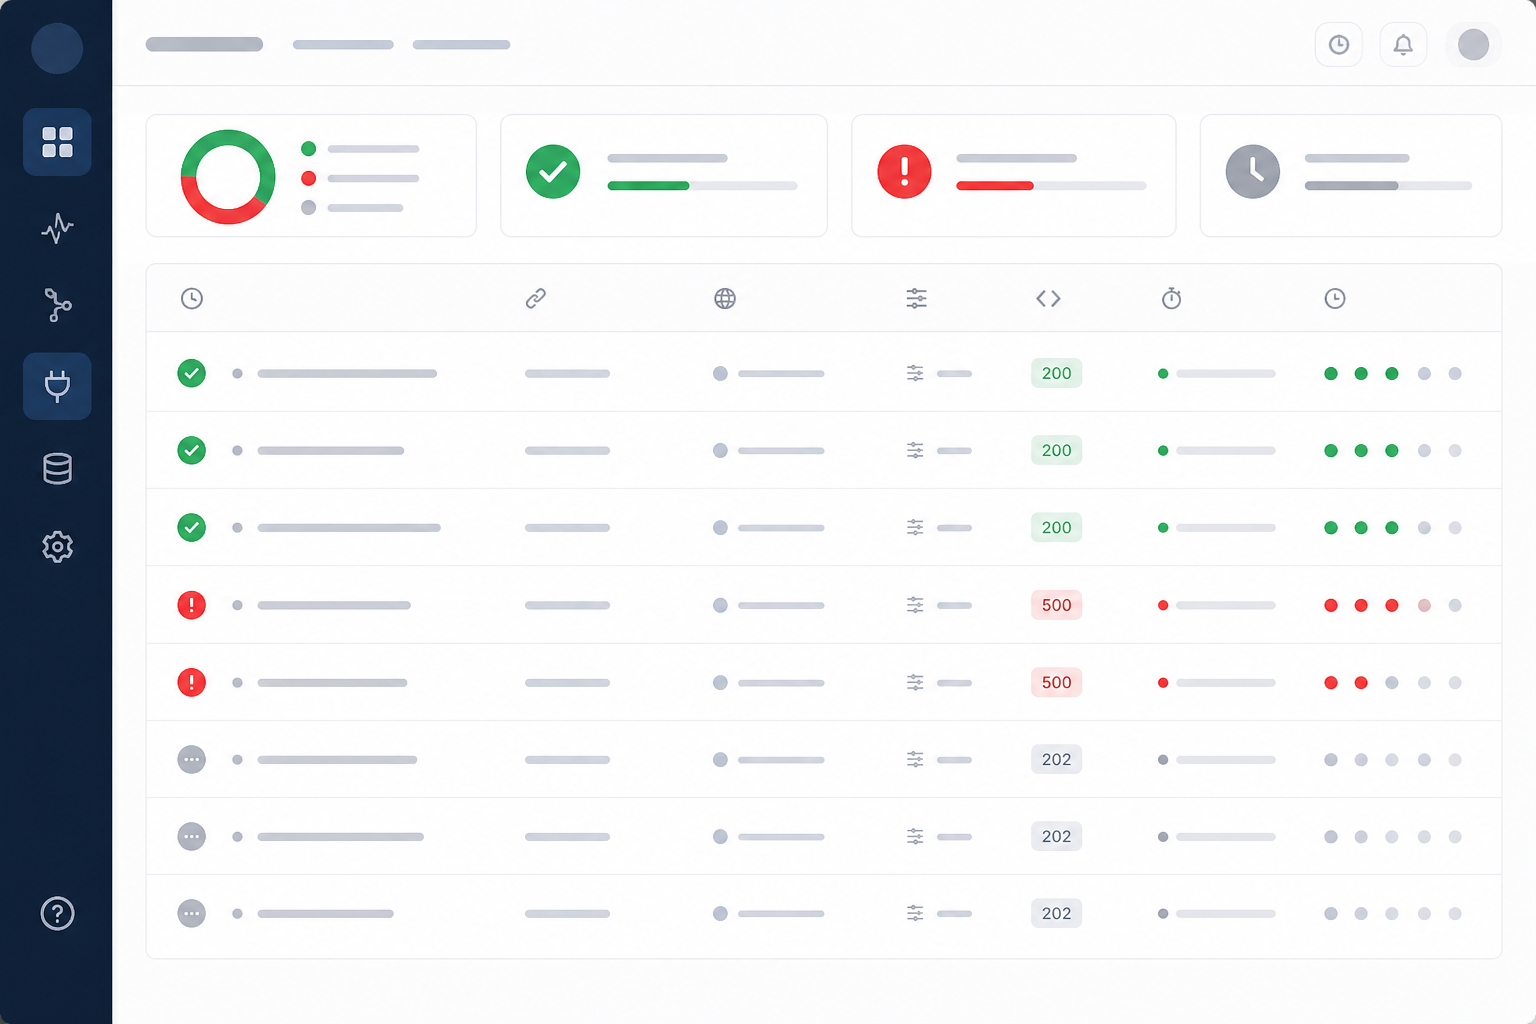
- Check your monitoring dashboard's delivery log first, if your platform provides one — it should show response codes and timestamps for each attempt, which tells you immediately whether the problem is on your end or the sender's.
- Confirm your endpoint isn't timing out or returning a non-2xx response. A slow database write before your response line is a classic culprit — move heavy processing to an asynchronous queue.
- Look for firewall, DNS, or authentication issues. A new WAF rule or an expired API key can silently block incoming requests without any obvious error on your side.
- Pull historical alert data through the monitoring API and compare it against what your endpoint actually logged receiving. If there's a gap, you've found your missing deliveries.
- Set up a fallback notification channel. Even with a solid webhook pipeline, it's worth keeping email or Discord alerts active as a safety net, so a webhook outage never means you find out about downtime from a customer instead of your monitoring system.
Pairing Webhook Alerts with the Monitoring API
Webhooks and the monitoring API solve two different problems, and the best setups use both. Webhooks push data to you in real time — you don't ask, they just arrive the moment something changes. The monitoring API, on the other hand, lets you pull historical incident data, response-time analytics, and monitor configuration whenever you need it.
Think of it this way: the webhook tells you an incident just started. The API lets you ask, “how long has this monitor been flaky this month?” or “what's the average recovery time for this service?” That's incredibly useful for backfilling context the instant a webhook fires, or for building your own reporting layer that goes beyond what any built-in dashboard offers. Just keep pagination and rate limits in mind when you're pulling larger historical ranges — most APIs cap how much you can request per call, so plan for looping through pages rather than one giant fetch. Reconciling API results against webhook events by event_id or monitor_id also helps you catch any gaps between what was delivered and what actually happened.
It also matters for a less obvious reason: portability. Access to your uptime history, SSL certificate timelines, and cron job records through an API means that data can live in a format you control, not only inside someone else's UI — though it's worth checking your specific plan for what's included in exports, how far back retention goes, and in what format. If you ever need to migrate, audit, or build custom reporting, knowing the real scope of that portability before you need it saves a lot of stress later, particularly if data residency or audit requirements are part of your compliance picture.
Frequently Asked Questions About Webhook Alerts
How do I receive monitoring alerts in my own system via webhook?
Add your endpoint's URL to your monitoring platform's alert settings, choose which monitors and status changes should trigger it, then send a test alert. Moonitor will POST a JSON payload to that URL when a monitored check changes state, so your system receives the alert in near real time. Always confirm your endpoint returns a fast 2xx response, and check your platform's documentation for its exact retry and timeout behaviour.
What does a typical webhook payload look like?
Most monitoring webhook payloads include a monitor ID and type, the current status (up or down), a timestamp, response time, and an error message if applicable — some platforms also include which region verified a failure. Treat any example payload as illustrative rather than a fixed schema, and check your platform's current documentation for the exact fields it guarantees.
How do I secure a webhook endpoint from abuse?
Use HTTPS, verify each request with a shared secret or HMAC signature checked against the raw request body, and restrict the endpoint to expected source IPs where possible as an extra layer. Rate-limit and validate incoming payloads before your system processes them, and never trust alert fields enough to pass them unvalidated into commands, queries, or internal URLs.
What happens if my webhook receives the same alert twice, or my endpoint is briefly down?
Most webhook delivery is at-least-once, not exactly-once, so duplicate deliveries can happen — usually from a retry after a network blip. Store each event's ID and check for duplicates before triggering anything irreversible. If your endpoint is briefly unavailable, keep a fallback channel such as email or Discord active so you're not relying on the webhook alone to catch every incident.
What's the difference between using webhooks and polling the monitoring API?
Webhooks push data to you the moment something happens, so there's no delay and no wasted requests checking for changes that haven't occurred. The monitoring API is better suited for pulling historical data, analytics, or configuration on demand — most teams end up using both together.
Webhook Alerts Deployment Checklist
At the end of the day, webhook alerts aren't really about replacing Slack or email — they're about giving your systems the same information a human would get, but in a form your infrastructure can actually act on. Before you consider your setup done, run through this:
- Endpoint accepts POST requests over HTTPS and returns a fast 2xx response
- Signature verification runs against the raw request body, not the parsed JSON
- Event IDs are stored and checked for duplicates before any irreversible action
- Heavy processing happens after the response, via a queue or asynchronous job
- Secrets are stored securely and rotated periodically, with overlap during rotation
- A fallback notification channel is active in case the webhook pipeline ever goes quiet
- You've confirmed the exact retry, timeout, and field guarantees in your platform's current documentation, rather than assuming
Wire it up once, secure it properly, and check it against your platform's real documented behaviour — and you'll spend a lot less time being the person who has to notice, decide, and act, and a lot more time trusting that your systems already have.