
How to Scale Your Monitoring Strategy From 10 to 500 Monitors
Build a monitoring strategy that scales from 10 to 500 monitors with clear naming, smarter alert routing, API management and regular reviews.

Here's the short version. What works at 10 monitors starts to creak around 50 and falls apart by 100, so your monitoring strategy has to change as you grow. Four habits do most of the work. Use consistent naming and grouping. Route alerts by service and severity to named owners. Manage monitors through an API once clicking gets tedious. Then review and prune on a regular schedule. Do those and 500 monitors stays calm instead of noisy.
I'll walk you through each stage below, so you can work out where you are now and what to fix next. No grand re-architecture required. 🌙
Why a monitoring strategy that works at 10 monitors falls apart at 100
Picture the first afternoon. You set up ten monitors: the marketing site, the API, a couple of servers, the nightly backup job. Everybody on the team knows what each one is for, because everybody was in the room when you made them. Every alert lands in one shared inbox, and that's fine, because there are hardly any alerts.
Then the company ships a new service. Then another. Someone adds a staging environment. A contractor adds a few checks and leaves. Eight months later you have 100 monitors, and three quiet things have broken without anyone noticing:
- You can't remember what each monitor is for. A monitor called 'API check 3' meant something once. Now nobody's sure, and nobody wants to delete it in case it matters.
- Alerts reach people who can't act on them. The front-end developer gets paged about a database port, and the database owner never sees it.
- Nobody knows who owns what. When an alert fires, the first ten minutes go on working out whose problem it is.
The cost is predictable. Alert fatigue sets in, people mute the channel, and pages get ignored. Then the one real outage arrives and drowns in the noise. I've seen teams with excellent coverage and a terrible monitoring strategy, and the coverage didn't save them.
The good news is that this is a maturity problem, not a talent problem. There are roughly four stages, and each one needs slightly different habits.
The four stages of monitoring strategy maturity at a glance
The monitor counts below are rough guides. Your own team size and how fast you ship matter just as much as the number. Find the row that sounds most like your Monday morning.
| Stage | Typical symptoms | What to change | Ready to move up when |
|---|---|---|---|
| 1: about 1-10 monitors | One person, one alert channel, everything in your head | Cover the essentials; keep it simple | You start forgetting what a monitor is for |
| 2: about 10-50 | Scrolling to find things, vague names, a second channel appears | Naming, grouping, tags and check-interval tiers | Alerts regularly reach the wrong people |
| 3: about 50-200 | A noisy shared channel, unclear ownership, repetitive setup | Severity-based routing, named owners, API-driven management | You create the same five monitors for every new service |
| 4: about 200-500 | Stale monitors, drift between environments, status page overload | Automation by default, scheduled reviews, pruning, status pages per audience | You're here; keep the loop running |
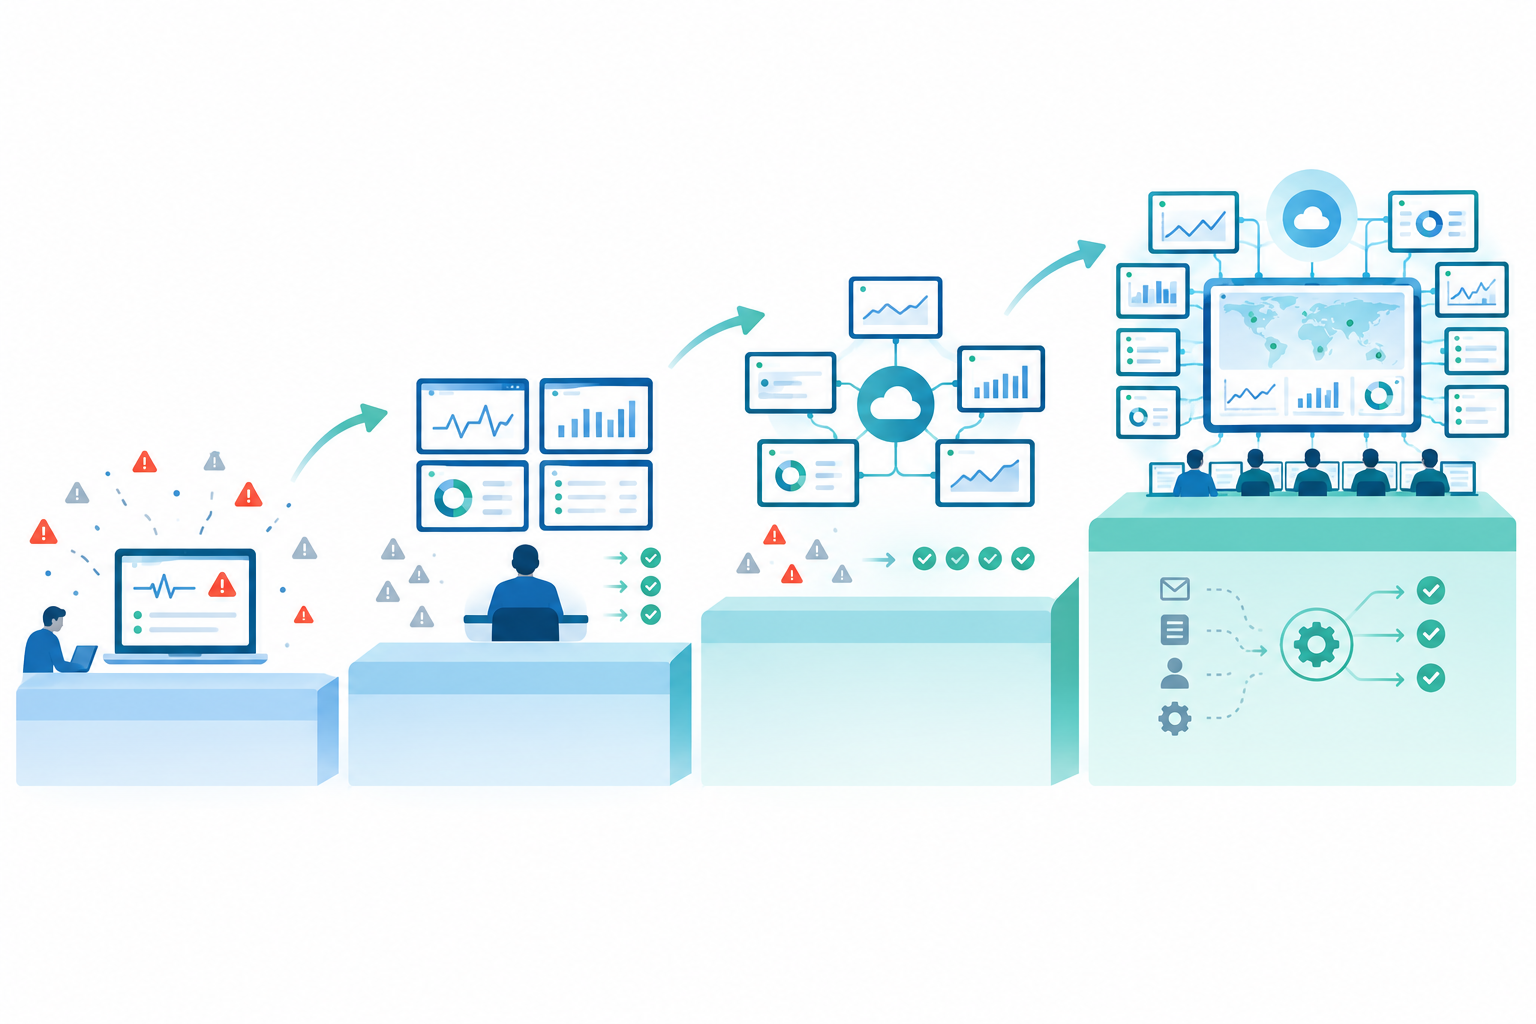
Not sure where you sit? Here are some warning signs:
- 'I scroll to find a monitor.'
- 'We mute that channel.'
- 'Whose is this one?'
- 'I think that monitor is for a service we shut down.'
- 'I just created the same monitors again by hand for the new project.'
If two or more of these sound familiar, you're probably at the edge of your current stage.
Stage 1 (up to 10 monitors): start with coverage, not perfection
At this stage, resist the urge to over-engineer. You don't need severity matrices or a naming committee. You need coverage of the things that hurt most when they break.
Here's what I'd cover first:
- Website and uptime monitoring for your main site, plus a keyword check so you catch the page that returns a 200 but shows an error message.
- API monitoring for your key endpoints, ideally a health endpoint and one or two that mirror real user journeys.
- SSL certificate monitoring, so expiry never surprises you. Expired certificates are embarrassing and completely avoidable.
- Heartbeat monitoring for cron jobs, from the start. Silent failures in scheduled jobs are the ones people discover weeks later, when the backup turns out not to have run since March.
Turn on multi-region failure verification from day one. When a check fails, Moonitor confirms it from other regions before alerting you, so a single network blip doesn't wake you at 3am. That matters more than you'd think, and I'll come back to why.
Keep the rest simple: one alert channel, one person responsible, and no process. Setup takes under a minute per monitor, so there's no excuse to put off the unglamorous ones. The boring monitors are the ones that save you.
Stage 2 (10-50 monitors): naming and grouping conventions
Somewhere around monitor twelve or fifteen, you'll catch yourself scrolling to find something. That's your cue. The cheapest change with the biggest payoff is a set of conventions.
Here's how I'd set them up.
- Pick a naming pattern and stick to it. A good one is environment, service, check type and endpoint, for example
prod | payments-api | http | /health. The exact order matters less than everyone using the same one. - Name for 3am. An alert should make sense on a phone lock screen without opening the dashboard. If the name tells you the environment, the service and what failed, you've already saved five minutes.
- Group by service or product first, environment second. It mirrors how people think when something breaks: 'payments is down', not 'everything in production with a P is down'. Grouping by team works if your teams are stable, but teams reorganise far more often than services do, and then your groups are wrong overnight.
- Use tags for cross-cutting concerns, like customer-facing, internal, third-party dependency or compliance-related. Tags let you slice the list in ways groups can't.
- Decide check intervals by tier. For example, critical monitors at 1 minute and low-priority ones at 5 minutes. Deciding once beats debating it per monitor.
- Write it all down. A one-page doc in the repo is plenty, and new teammates will follow conventions they can actually find.
Here's what bad versus good looks like:
- ❌
Test 2→ ✅staging | auth-api | keyword | login page - ❌
John's server→ ✅prod | web-01 | ping | host - ❌
cron thing→ ✅prod | billing | heartbeat | nightly-invoice-run - ❌
SSL→ ✅prod | marketing-site | ssl | www
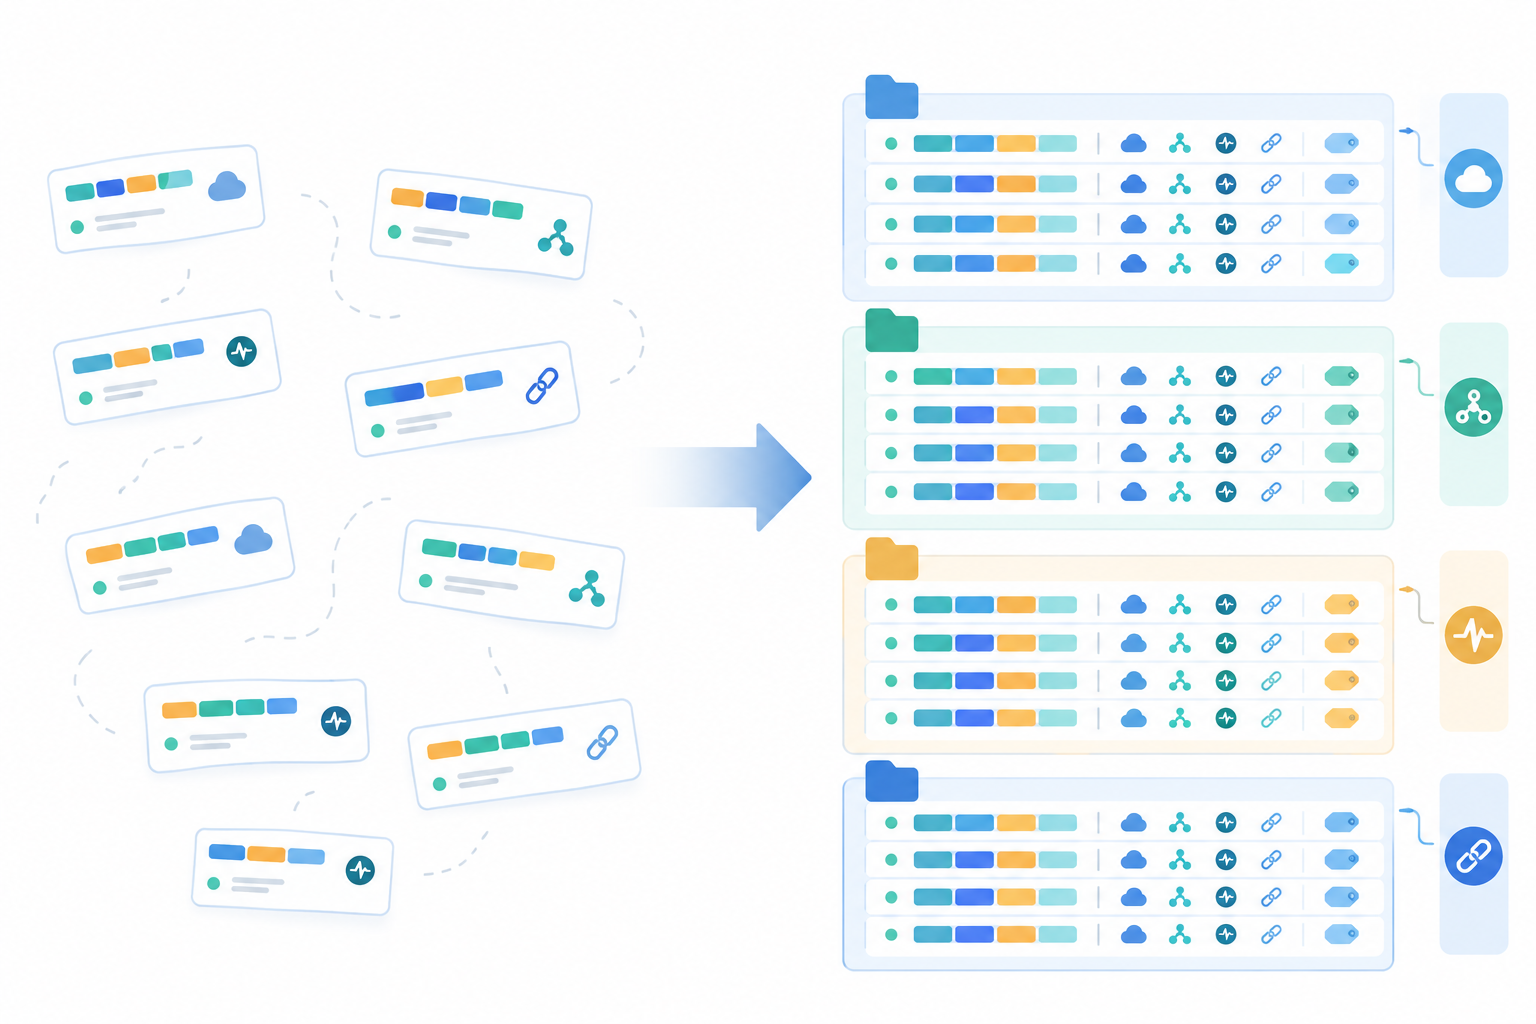
Do this before you reach 50 monitors. Renaming 40 is an irritating afternoon. Renaming 400 is a project nobody wants to own.
Stage 3 (50-200 monitors): route alerts by service and severity
This is where most teams get into trouble. Alerts multiply, and the shared channel turns into a firehose. The fix is routing: the right alert goes to the right people through the right channel.
Start by defining severity in plain language that nobody needs to look up:
- SEV1: a customer-facing outage. Someone needs to act now.
- SEV2: degraded or at risk. Someone needs to look soon.
- SEV3: needs attention this week. It's not urgent, but it shouldn't be forgotten.
Then map each severity to a channel and an expected response:
| Severity | Example monitors | Channel | Expected response |
|---|---|---|---|
| SEV1 | Failing payment API, main site down, production port closed | Phone-notifying channel such as Telegram, or a webhook into your on-call tool | Minutes, escalate if unacknowledged |
| SEV2 | Slow response times, SSL certificate expiring in 3 days, DNS record change | Team Slack or Discord channel | Within the working day, or sooner if out of hours |
| SEV3 | SSL expiring in 30 days, internal tool down, low-priority heartbeat late | Email digest | This week |
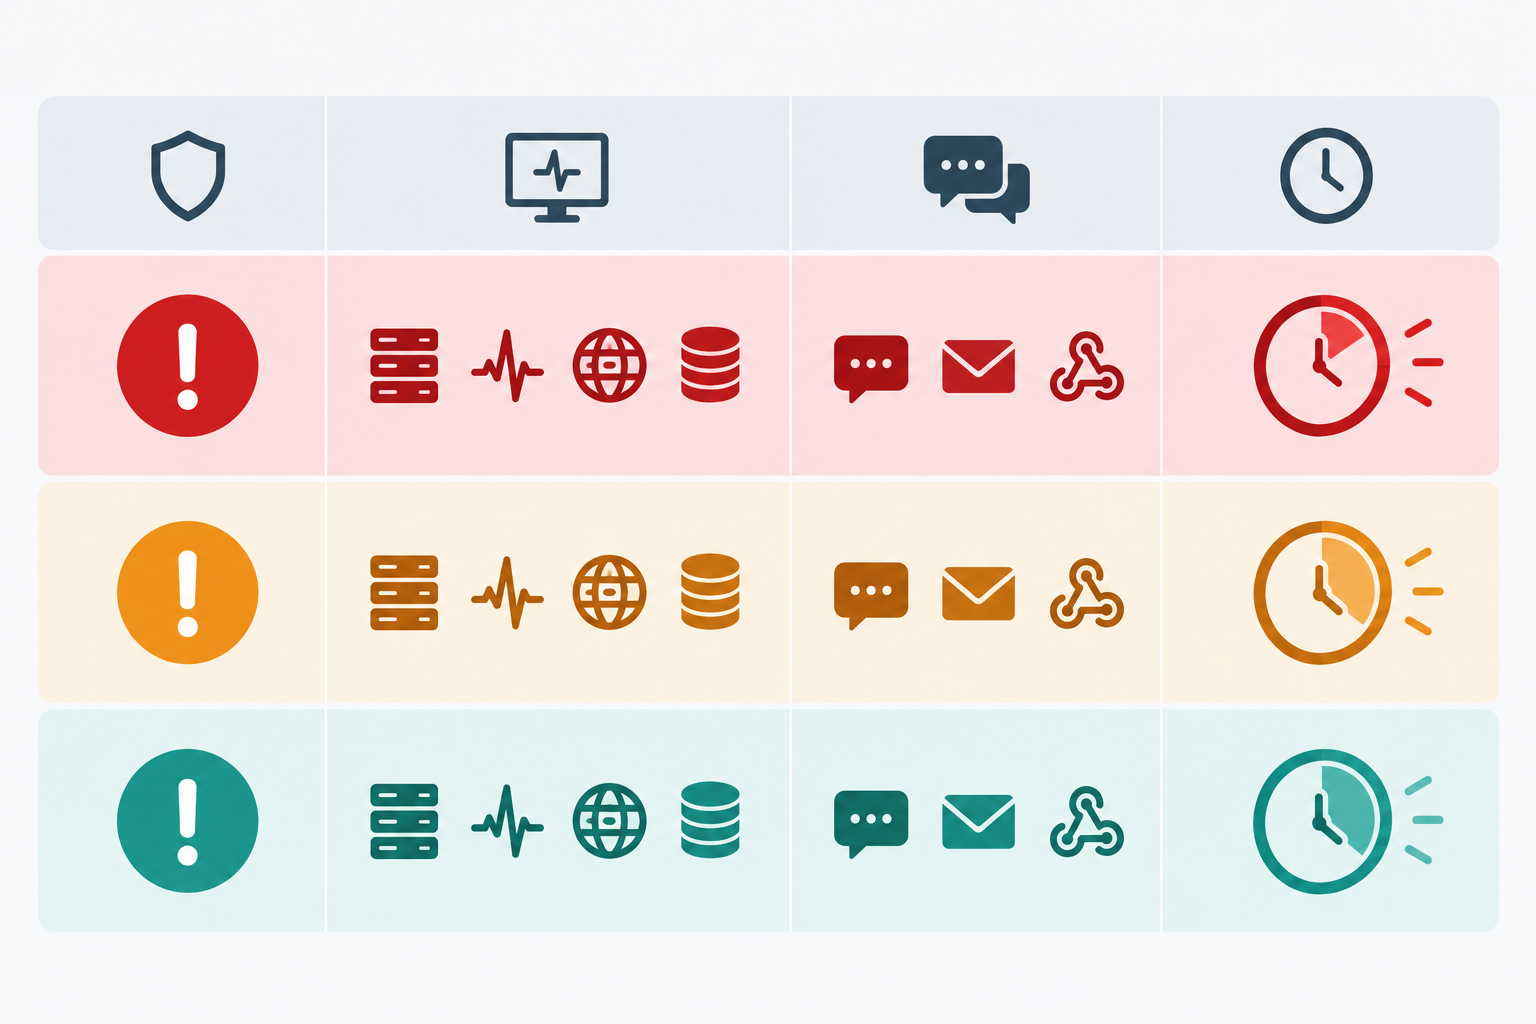
A few notes on how monitor types usually map. A failing payment API is critical, full stop. An SSL certificate expiring in 30 days is low priority, but at 3 days it's high. A DNS record change deserves a security-flavoured alert, because an unexpected change could be a mistake or something worse, and DNS monitoring is how you find out which.
Feeding your existing tools
Webhooks are your friend here. Moonitor can send incident alerts into PagerDuty-style on-call systems or ticketing tools, so you aren't asking people to watch yet another inbox. You'll also want to decide on escalation: what happens if nobody acknowledges within 10 or 15 minutes? Write the answer down rather than improvising it at 3am.
The 'everything goes to #alerts' trap
We've all seen it. One channel, every alert, and a quiet agreement that nobody reads it. Here's a quick test: if more than one person has muted a channel, it's too noisy. Split it by service or severity until nobody wants to mute it.
This is also why multi-region verification matters more as you grow. False positives scale with monitor count. If one in a thousand checks produces a false alarm from a network blip, that's a rare annoyance at 10 monitors and a daily one at 500. Verifying failures from several regions before alerting keeps your alert volume honest.
Ownership and on-call mapping: give every monitor a named owner
The principle is blunt: a monitor without an owner is a monitor nobody will fix. It'll fire, someone will say 'not mine', and it'll fire again tomorrow.
There are a few practical ways to record ownership:
- Naming prefixes that include the team or service.
- Tags such as
owner:payments. - A simple service catalogue in a spreadsheet or in your repo.
Then build the chain. Each service maps to a team, each team to an alert channel, and each channel to an on-call rotation. If any link is missing, alerts fall through the gap.
A few situations need special care:
- Shared infrastructure. DNS, SSL certificates and servers rarely belong to one product team. Assign a platform owner so these don't become everyone's job and therefore nobody's.
- Cron job monitoring. This is the classic gap. The person who wrote the job left months ago, the heartbeat still fires its alert, and nobody knows what the job does. Make sure every heartbeat monitor names a current owner.
- Third-party dependencies. Someone still needs to decide what to do when the external API goes down.
A simple template keeps it tidy. For each monitor, record:
| Monitor | Service | Owner | Severity | Runbook link |
|---|---|---|---|---|
| prod, payments-api, http, /health | Payments | Payments team | SEV1 | Link to the runbook |
Finally, close the loop. Use incident history and response-time analytics in your post-incident reviews. If the same monitor keeps firing, either the service needs work or the monitor needs tuning. Either way, ownership means someone acts on it.
Managing monitors at scale: move from the dashboard to the API
Can you manage monitors by API? Yes, and at this scale you probably should. Moonitor has a full API, so you can create, update and remove monitors programmatically and export your data.
When should you switch? A good trigger is when you catch yourself creating the same five monitors for every new service or environment. That's repetition, and repetition is what scripts are for. For most teams this lands somewhere between 50 and 100 monitors.
Here's a sensible path:
- Export your current monitors and use that as your baseline. You get a snapshot of reality, and you're never locked in, because your data is always yours to take.
- Store monitor definitions as code in version control, alongside the service they watch. Changes get reviewed like any other change. Terraform works on the same principle: you keep definitions in version control and import existing resources rather than rebuild them by hand.
- Create monitors automatically in your deployment pipeline when a new service ships, and remove them when it's retired. No ticket, no forgotten checks.
- Use scripts for bulk changes, like adjusting intervals, updating alert contacts or adding a tag to 80 monitors at once. It's a ten-minute script versus a tedious afternoon.
- Add a drift check that compares what's defined in code with what's live. Someone will always click something in the dashboard at 2am during an incident, and a drift check catches it afterwards.
Here's an illustrative example, not real endpoints. It's a monitor definition and the pseudo-code that applies it. Check the Moonitor API docs for the actual calls.
## monitors/payments-api.yaml (example)
name: prod | payments-api | http | /health
type: http
url: https://payments.example.com/health
interval: 60
tags: [owner:payments, severity:sev1, customer-facing]apply.py (pseudo-code)
for definition in load(monitors/):
    existing = api.find_by_name(definition.name)
    if existing:
        api.update(existing.id, definition)
    else:
        api.create(definition)
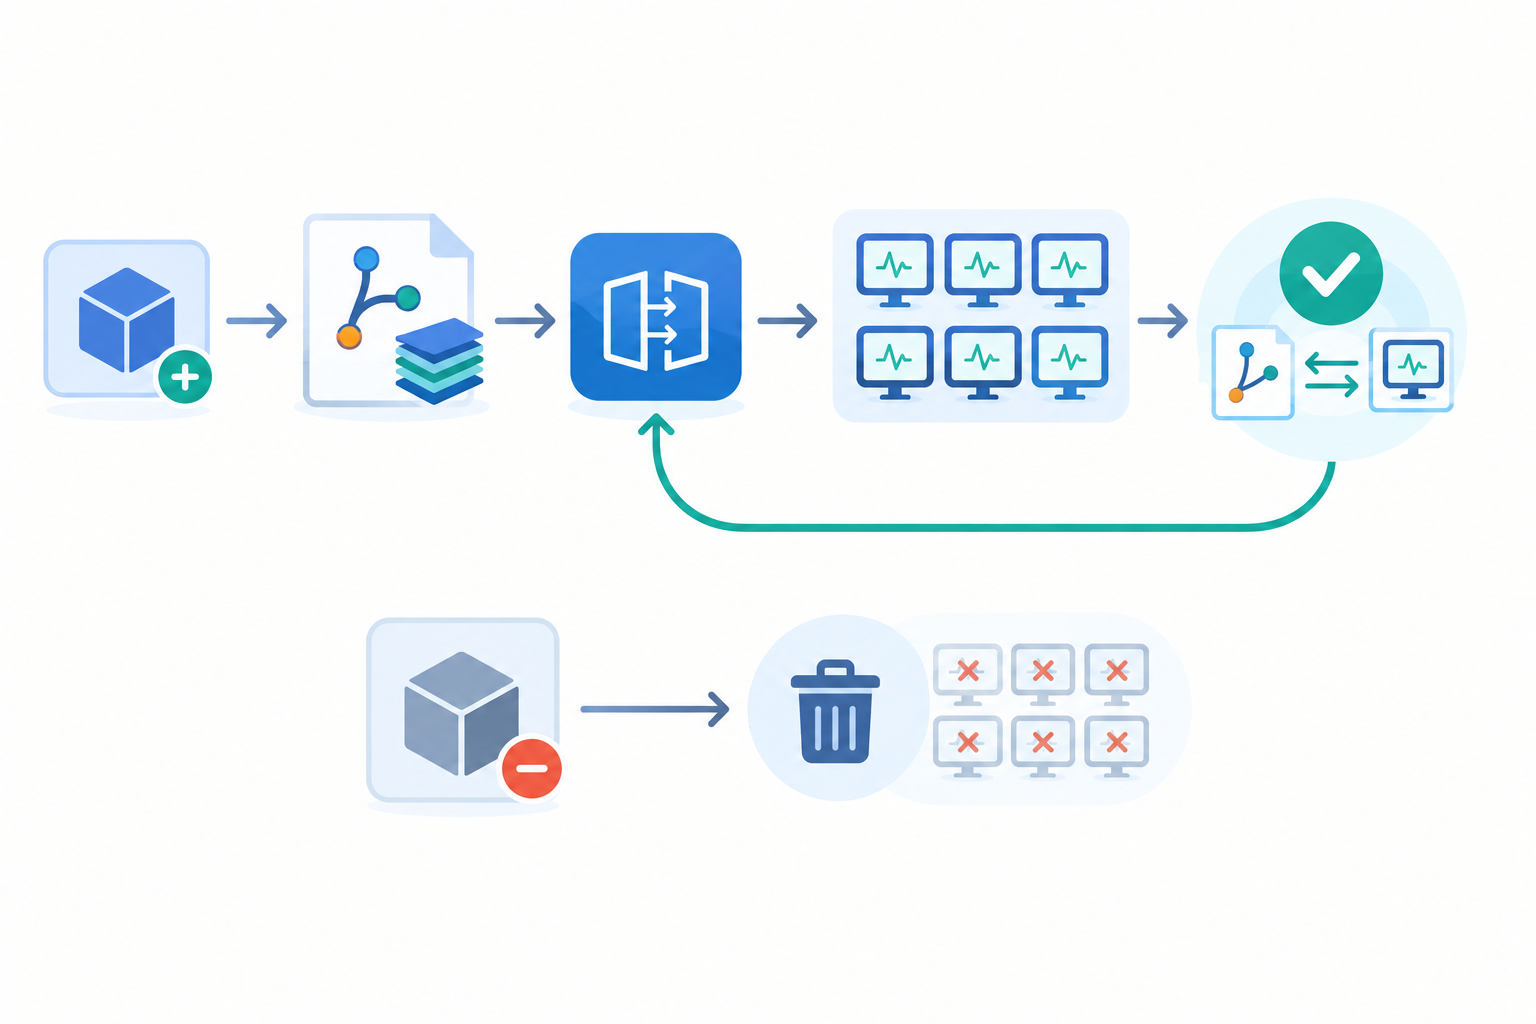
A few habits make API automation safe:
- Make scripts safe to rerun. Use stable identifiers and update existing monitors rather than creating duplicates.
- Handle rate limits with backoff. Every API has them and they vary, so don't assume one universal request rate.
- Test in a small batch before changing 200 monitors at once.
- Keep API keys in a secret manager or your CI/CD secret store, never in the monitor files.
- Agree your naming and tag conventions first. Importing a mess just gives you a version-controlled mess.
One bonus: pair this with your branded public status page, so a new service appears there as part of the same workflow instead of being remembered later.
Stage 4 (200-500 monitors): review and prune monitors regularly
At 500 monitors, adding things is no longer the hard part. Keeping them useful is. How often should you review? I'd suggest three rhythms:
- Weekly (15 minutes): look at the noisiest monitors and the alerts nobody acted on. Those are your first tuning candidates.
- Monthly (per team): check for monitors pointing at decommissioned services, wrong severity levels and stale contacts, such as someone who left or changed teams.
- Quarterly (a deeper audit): compare coverage against your service list to find gaps, confirm ownership and check intervals, and make sure SSL and domain expiration monitoring covers everything customer-facing.
Use response-time analytics and incident history to decide what to tune, keep or retire. If a monitor has fired fifty times and nobody has ever done anything, the data is telling you something.
Pruning criteria
Delete or rework a monitor when:
- It has no owner.
- Nobody has ever taken action on its alerts.
- It duplicates another check.
- The service it watches is gone.
Not sure? Pause it first, and archive or export the history before deleting. You can always bring it back.
And a gentle reassurance, because I know deleting monitors feels risky: removing a monitor isn't reducing safety when what remains is the set that matters. A smaller set of monitors people trust beats a large set they ignore. It's worth being ruthless about this.
Keeping status pages and communication in step with growth
A single status page works nicely at 10 monitors. At 200 it turns into a wall of components that customers can't read and you can't keep accurate. The answer is separation: one public page for the customer-facing components, and internal views for the rest.
That doesn't mean linking all 500 monitors to it. Tie a handful of your most critical monitors to status components, such as the app, the API and the dashboard, and keep the supporting detail internal. A branded public status page cuts support load during incidents, because customers can check it instead of emailing you. Over time, a clear incident history also builds trust. It shows you notice problems, fix them and tell people honestly.
Choosing monitoring tools and plans that grow with you
I'll keep this light-touch. When you choose a platform, look beyond the number of monitors it allows. What matters at 500 is the daily workload: tagging, shared alert policies, ownership, exports and API limits. The most useful test is to pilot with a representative set of services before you migrate everything.
A platform that handles all your monitor types in one dashboard saves real effort. Moonitor covers HTTP/S, keyword, port, ping, SSL, domain expiration, DNS record change and heartbeat monitoring. That puts server monitoring, cron job monitoring and DNS monitoring alongside your website monitoring, rather than spread across three tools with three alert setups.
It also helps to decide what to watch before you decide how many monitors to add. Google's SRE guidance suggests latency, traffic, errors and saturation as a starting framework. Pair that with a few service-level objectives and a bigger inventory is less likely to become a bigger pile of low-value notifications.
On pricing, Moonitor's plans run from the Solo plan at $14/mo for 20 monitors up to the Max plan at $49/mo with unlimited monitors, and there's a 7-day free trial with no credit card needed. Prices are in USD, so if you're in the UK, check at checkout for any tax or currency considerations.
A short checklist of what to look for:
- API coverage for creating, updating and removing monitors
- Data export, so you can leave if you need to
- Multi-region failure verification
- Flexible alert channels (email, Slack, Discord, Telegram, webhooks)
- Status pages and incident history
Your next step: a 30-minute monitoring strategy tune-up
You don't need a big project. Set a timer for 30 minutes and try this:
- Look at your monitor list and spot the three worst names. Rename them using your new pattern.
- Pick one noisy alert channel and split it by severity. Even two channels is a big improvement over one.
- Assign an owner to every monitor that doesn't have one. Start with the cron jobs.
- Export your monitors via the API and commit the file to version control. That's your baseline for automation later.
- Book a recurring 30-minute review in the team calendar. If it isn't scheduled, it won't happen.
One improvement this week beats a perfect plan you never start. Your future 3am self will thank you. 💙
FAQ
How should I organise hundreds of monitors?
Use a consistent naming pattern (environment, service, check type, endpoint), group monitors by service first, and add tags for cross-cutting concerns such as customer-facing or third-party. Write the convention down so everyone follows it as the list grows.
Who should receive which monitoring alerts?
Route by service and severity. Critical, customer-facing failures should go to the owning team's on-call channel with escalation, medium issues to the team's chat channel, and low-priority items such as upcoming SSL expiry to email. Each alert should reach someone who can act on it.
Can I manage monitors by API?
Yes. With Moonitor's API you can create, update and remove monitors programmatically and export your data. Many teams define monitors in code and create them as part of their deployment pipeline once they pass roughly 50 to 100 monitors.
How often should I review my monitors?
A good rhythm is a quick weekly look at noisy alerts, a monthly review of stale or misconfigured monitors, and a quarterly audit of coverage, ownership and check intervals.
How many monitors is too many?
There isn't a magic number. The real test is whether every monitor has an owner, a clear purpose and an alert someone would act on. If not, prune it or fix it.