
Port and Ping Monitoring: When and Why You Need Them (And What HTTP Checks Miss)
Learn how port monitoring differs from ping monitoring, what HTTP checks miss, and how to monitor databases, mail servers, and other TCP services.
Port Monitoring vs Ping Monitoring: What HTTP Checks Miss
Port monitoring and ping monitoring aren't the same thing. Here's what each one actually verifies, where they fall short, and how to build server monitoring that covers what HTTP checks can't see.
Here's the short version: port monitoring checks whether a specific service—like PostgreSQL on port 5432 or SMTP on port 25—is accepting TCP connections, while ping monitoring only confirms that a host responds to a network-layer request. They sound similar, but they are not the same thing, and neither one is a complete health check on its own. A port check proves connectivity to a listener; it doesn't prove the service behind that listener is healthy, authenticated, or doing its job correctly.
If you're only running HTTP checks right now, you might be missing failures in every non-web service you depend on: databases, mail servers, SSH access, and custom TCP services. A host can respond to ping perfectly happily while the exact service you care about on that host is completely, silently dead. I've watched teams get caught out by exactly this gap—monitoring dashboards all green while users are staring at errors.
Let's dig into why this happens, what port and ping checks can and can't tell you, and how to build server monitoring that actually closes the gap.
Why HTTP Monitoring Isn't Enough for Every Service
Most of us start our uptime monitoring journey the same way: we set up HTTP checks on our website and API endpoints, because that's the part of our infrastructure facing the public internet. It's the obvious first move, and honestly, it's a good one. But it isn't the whole picture.
Here's the thing—plenty of critical infrastructure has no HTTP interface at all. Your database doesn't speak HTTP. Your mail server doesn't either. Neither do most message queues, internal APIs on custom ports, or the SSH daemon you rely on to get into a box during an incident. HTTP monitoring simply has nothing to say about any of these services.
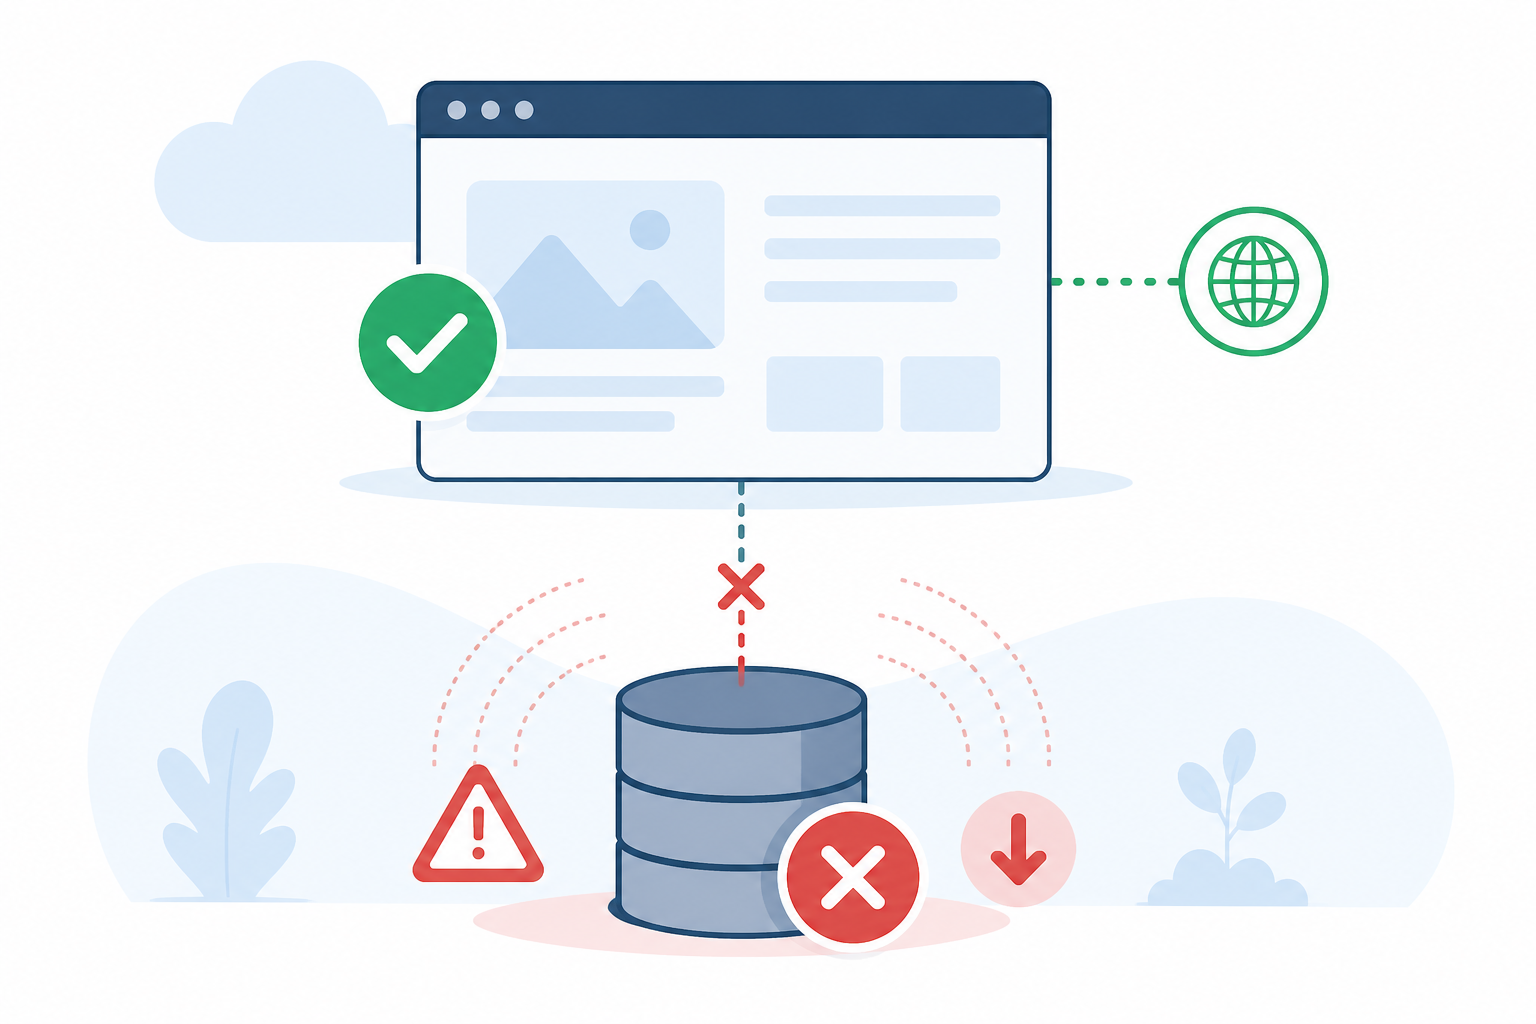
Let me paint you a scenario I bet sounds familiar. Your web app's HTTP health check is returning a cheerful 200 OK every 60 seconds, right on schedule. Everything looks green on your dashboard. Meanwhile, your Postgres instance has quietly run out of connections, crashed, or become stuck under a lock that's never releasing. The app server itself is fine—it's up, it's responding, and it's technically “healthy”. But every request that touches the database is failing behind the scenes because the connection pool is exhausted and nothing is getting through.
Your monitoring says everything's fine. Your users are staring at error pages. That gap—the space between “the app server responds” and “the actual service works”—is exactly what proper server monitoring, built from layered checks rather than HTTP alone, exists to close.
What Port Monitoring Checks—and What It Doesn't
A TCP port check does something refreshingly simple: it attempts a TCP handshake with a specific port on a host. If the handshake completes, that tells you something is listening on that port and accepted the connection. That's genuinely useful—but it's also the limit of what a basic connect check proves. It doesn't confirm that the service is authenticated, responsive at the application layer, or processing requests correctly. A database process can accept a TCP connection and still be too overloaded to run a query, or a service can crash immediately after the handshake and a basic port check would never know.
That's a meaningfully different signal from ping monitoring, because it tells you whether something specific is running on that port—not just whether the machine underneath it is powered on and connected to the network. To get real confidence, you generally want to layer a protocol-level or application-level check on top: an authenticated PostgreSQL connection that actually runs a query, an SMTP session that completes an EHLO handshake, a Redis PING command that expects a PONG back, or an API health endpoint that checks its own dependencies before responding.
UDP deserves its own callout here because it behaves quite differently from TCP. UDP is connectionless—there's no handshake to complete, so a generic “is this UDP port open?” probe is often ambiguous. A lack of response might mean nothing is listening, or it might mean the service is silently dropping unexpected packets, which is normal behaviour for many UDP services. Meaningful UDP monitoring usually requires a protocol-aware probe that sends a real request and checks for the expected response—think a DNS query against port 53 or an NTP request against port 123—rather than a blind connection attempt.
A few concrete examples make the TCP side click:
- Checking port 5432 tells you something is accepting TCP connections where Postgres should be listening—pairing it with an authenticated connection check confirms Postgres itself is actually responding.
- Checking port 3306 tells you a listener is present where MySQL should be—again, a real login-and-query check gives you the fuller picture.
- Checking port 22 confirms that a TCP listener is available on the SSH port, which matters enormously when you need to get into a server quickly during an incident.
This is the layer of server monitoring that most teams skip until something breaks and they realise their HTTP checks never had visibility into it. Just don't mistake “the port answered” for “the service is healthy”—they're related, but they're not the same claim.
What Ping Monitoring Checks—and Its Limits
Ping monitoring works at a completely different level. It uses ICMP—the protocol behind the classic ping command—to send an echo request to a host and wait for an echo reply. That's the entire test. It doesn't know or care what services are running on that host. It just wants to know: did something at this address respond to an ICMP packet right now?
That narrower scope is exactly what makes ping monitoring useful in the right context. It's a reasonable first-pass check for basic network reachability, particularly for infrastructure that has no exposed application port to check—things like internal load balancers, network appliances, or VPN endpoints where there's no single “service” to point a port check at.
But ping is less definitive than it looks. A successful reply doesn't prove a machine is “powered on and healthy”—it proves an ICMP echo response made it back to your monitor, which depends on routing and firewall policy along the way. And a failed ping doesn't necessarily mean the host or network is down, either: plenty of hosts and network devices are configured to filter or rate-limit ICMP entirely, so a failed ping can just as easily mean “this host silently ignores ping” as “this host is unreachable”. That's the misconception I run into constantly—teams assume “the server pings fine” means “the server is fine”, and treat a failed ping as automatic proof of a network outage. Neither assumption holds up. The safer approach is to treat ping as one data point and correlate it with TCP and application-level checks before you draw a conclusion about what's actually wrong.
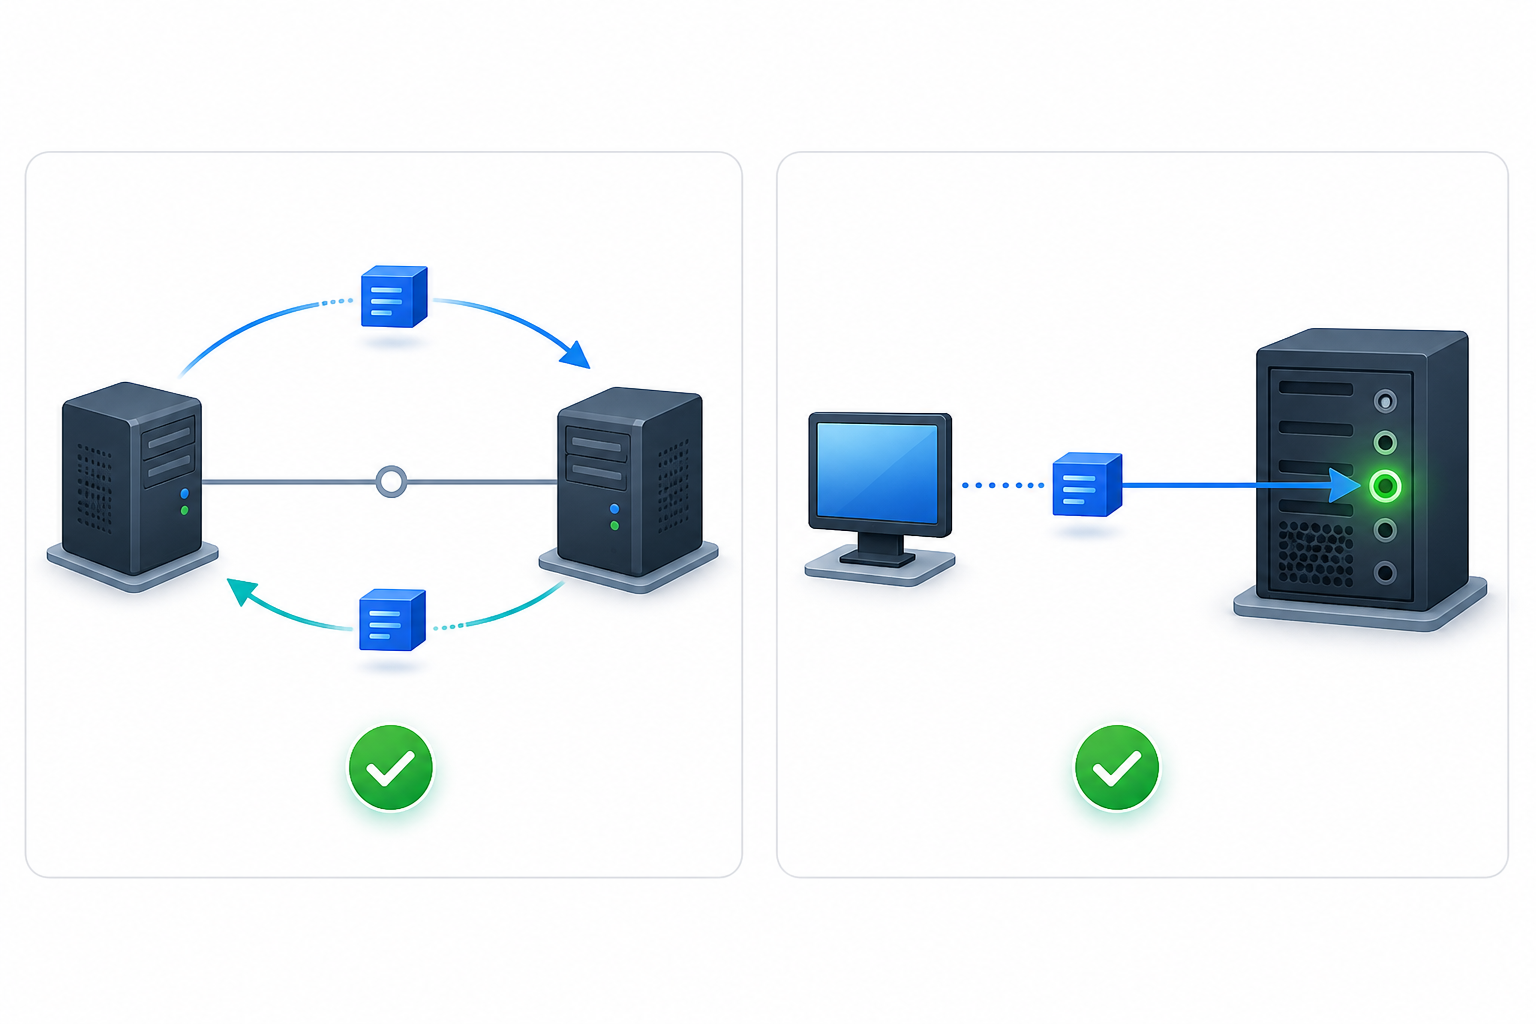
A useful mental shortcut is: use ping monitoring for basic host reachability, TCP port monitoring for listener availability, and protocol- or application-level checks for real service health. Each layer answers a different question, and none of them substitutes for the others.
Port Monitoring Use Cases: Databases, Mail Servers, and More
Once you start thinking in terms of “what port does this service actually listen on?”, a whole category of monitoring gaps becomes obvious. Here's where port and ping monitoring earn their keep—alongside a note on doing this safely, because exposing administrative and database ports for monitoring isn't something to do casually.
- Databases: port checks on 5432 (Postgres), 3306 (MySQL), 6379 (Redis), or 27017 (MongoDB) catch a crashed or overloaded database process even when the host it lives on is perfectly reachable. Where possible, pair the TCP check with an authenticated connection or a lightweight query, and avoid exposing database ports to the open internet purely for monitoring—use a private monitoring agent inside your network, or restrict access to a tightly allow-listed set of monitoring IPs.
- Mail servers: port checks on 25, 465, and 587 (SMTP) and 993 (IMAP) matter because a mail queue backing up often doesn't show up in HTTP monitoring at all. Where supported, check that TLS negotiates correctly and that the server completes an SMTP handshake, not just that the port answers.
- SSH access: monitoring port 22 means you know before an incident starts whether you can actually get into a server to fix it. Given how sensitive SSH access is, this is a strong candidate for restricting checks to a private network path or a known monitoring IP range rather than leaving it open to the wider internet.
- Internal APIs and microservices: many of these run on non-standard ports such as 8080 or 9000, with no public HTTP endpoint that a keyword or HTTP monitor could ever check. An application-level health endpoint, even an internal one, gives you far more signal than a bare TCP check.
- Network infrastructure: routers, VPN gateways, and load balancers often don't have one specific service port to target—this is where ping monitoring for basic reachability fills the gap, ideally backed up by a TCP check against whatever management or data port is actually relevant.
Once you map your infrastructure this way, it's usually pretty clear which pieces have been sitting outside your monitoring coverage the whole time—and which ones need firewall rules or private monitoring locations rather than public exposure.
Setting Thresholds for Non-HTTP Services
Non-HTTP services often have a much tighter tolerance for downtime than a typical webpage does, but the right threshold really depends on the service's role and your own SLOs, not a fixed rule of thumb. If your homepage is down for 30 seconds, that's annoying. If your primary database is down for 30 seconds, that can cascade into connection pool exhaustion across your entire application, turning a brief blip into an outage that outlasts the original problem.
A few practical guidelines, adjusted to how critical the service is:
- Set shorter check intervals—30 to 60 seconds—for anything sitting in a critical request path, such as a primary database or cache layer, where a short outage has an outsized downstream cost. Less critical internal services can usually tolerate 2–5 minute intervals without meaningfully increasing your time-to-detect risk.
- Use consecutive-failure thresholds for mail servers specifically, since SMTP issues are often intermittent. Requiring 2–3 failed checks before alerting helps you avoid noisy false positives from a momentary network blip, at the cost of slightly slower detection.
- Lean on multi-region checks for anything internet-facing, so you can rule out a regional network hiccup before paging someone at 3am. Repeated false alarms are exactly how teams start ignoring pages because “it's probably nothing”.
- Pair port checks with response-time analytics so you can catch a service that's technically “up” but clearly degrading, rather than only getting a binary up/down signal.
Combining Monitoring Types for Full Server Coverage
Here's the thing I want you to take away from all this: the answer isn't “pick port monitoring, ping monitoring, or HTTP monitoring”. The answer is layering these checks across your stack—that's what genuine server monitoring coverage looks like—so every failure mode has something watching for it, and so you know what to check next when one signal goes red.
| Monitor Type | What It Confirms | What It Doesn't Detect | Recommended Follow-Up |
|---|---|---|---|
| HTTP/S monitoring | Public-facing endpoints return correct status codes and content | Backend service or database health behind the endpoint | Port or protocol check on the dependent service |
| Keyword monitoring | A page loads and contains expected content—catches broken deployments that still return a 200 | Non-visual regressions and backend errors not reflected in page content | Log-based or application monitoring |
| Port monitoring (TCP) | A listener on a specific port accepted a connection | Whether the service behind the port is authenticated, responsive, or correct | Protocol-level or application-level health check |
| Ping monitoring (ICMP) | An ICMP echo reply returned from the address, subject to routing and firewall policy | Service-level availability; a filtered host can fail ping while being fully healthy | TCP port check against the relevant service |
| Cron/heartbeat monitoring | Scheduled jobs actually ran and reported in | Whether a running job completed correctly | Job-level logging or output validation |
| SSL and domain expiration monitoring | Catches slow-motion outages from expired certificates or lapsed domains | Certificate misconfiguration beyond expiry, such as a wrong chain | Full TLS handshake validation |
| DNS monitoring | Alerts when DNS records change unexpectedly | Whether the new record actually points somewhere healthy | Combine with HTTP or port check on the new target |
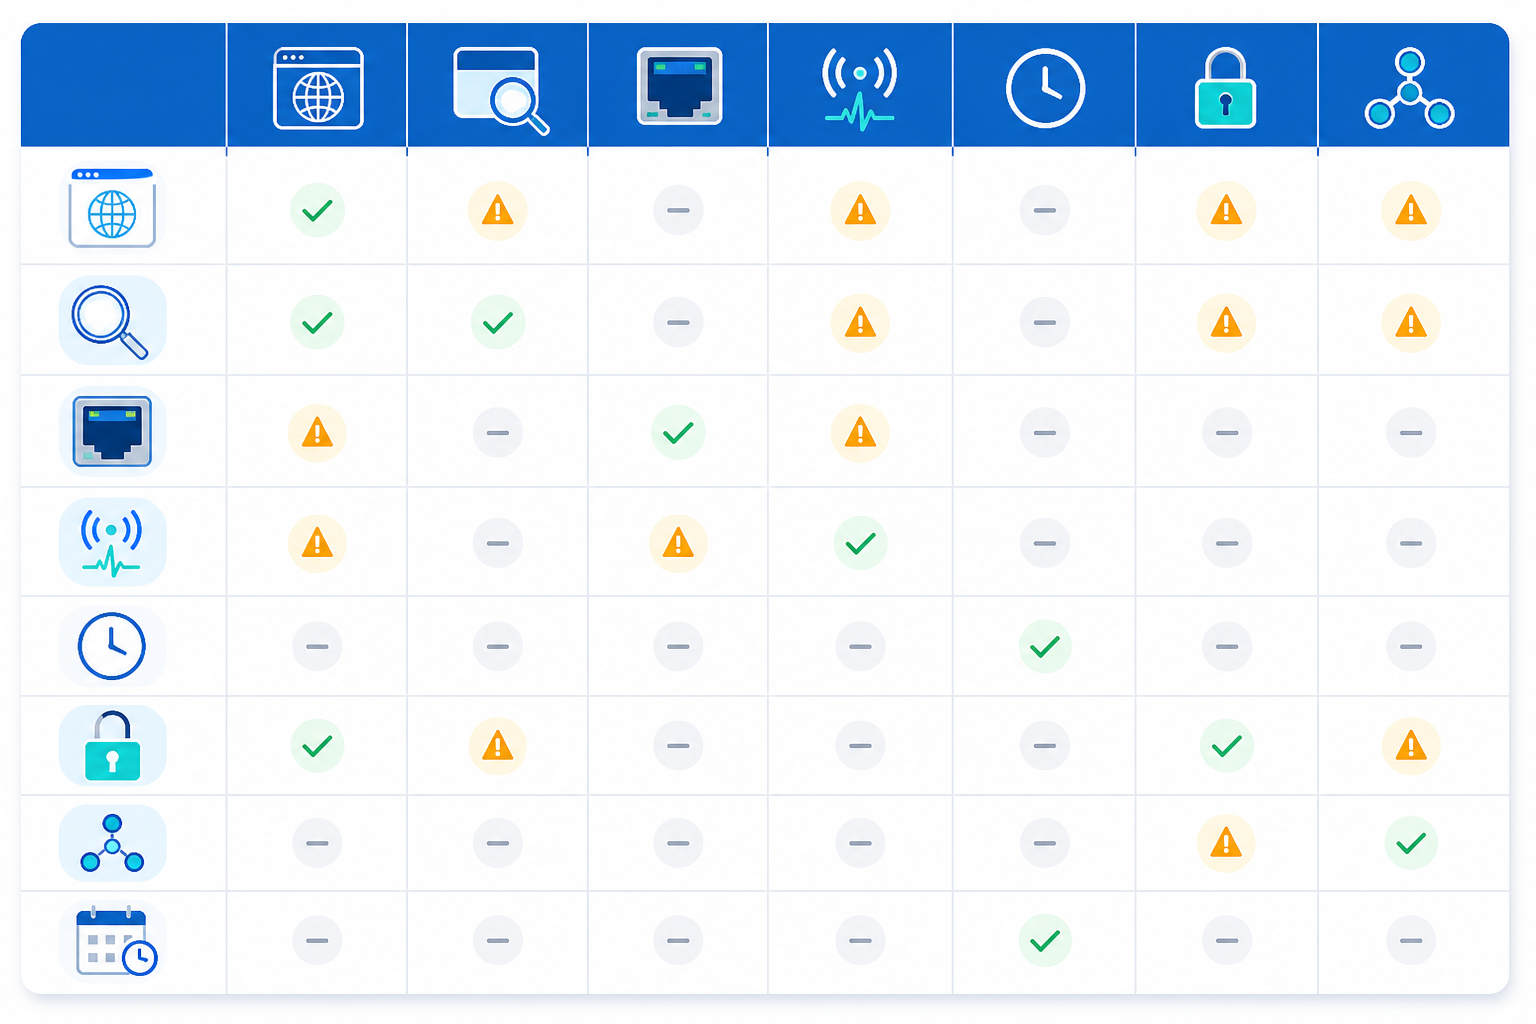
Every row in that table is a different failure mode, and every row also has a blind spot of its own. The goal isn't to find one perfect check—it's to make sure each blind spot is covered by a different monitoring layer.
How to Set Up Port and Ping Monitoring
In practice, building this out doesn't require anything exotic. Start by listing every service that isn't HTTP—your databases, mail servers, SSH access, and internal APIs—and note the port each one listens on. For anything sensitive, decide now whether it should be monitored from a private network location or an allow-listed IP range rather than exposed publicly. Then add a TCP port check for each service, layer in an authenticated or protocol-level check where the tooling supports it, and use ping monitoring only for the handful of hosts that genuinely have no service port to target. Set your check intervals and failure thresholds based on how critical each service is, as covered above, and route alerts somewhere your team will actually see them quickly.
That's the same approach we built into Moonitor: port and ping monitoring alongside HTTP, keyword, cron, SSL, and DNS checks, all from one dashboard, so you're not juggling three or four separate tools to get this kind of coverage. Multi-region verification is available for port and ping checks as well, which helps reduce false alarms caused by a single flaky network hop. Alerts route to Slack, Discord, Telegram, email, or webhooks, wherever your team already works.
If you want to see what your current HTTP-only setup might be missing, you can start with a 7-day free trial—no credit card required.
FAQ: Port Monitoring and Ping Monitoring
Do I need port monitoring if I already monitor HTTP endpoints?
Yes, if you have any critical service that isn't itself an HTTP endpoint—databases, mail servers, SSH access, message queues, or internal services on custom ports. HTTP monitoring only tells you your web-facing app is responding; it says nothing about whether the database or service behind it is actually reachable.
What's the difference between ping monitoring and port monitoring?
Ping monitoring (ICMP) confirms that an echo reply returned from an address, which depends on routing and firewall policy. It doesn't know what's running on the host, and a failed ping can mean the host is filtering ICMP rather than being down. A TCP port check goes further by attempting an actual handshake with a specific port, confirming that a listener there accepted the connection. Neither one proves the service behind it is fully healthy.
Which services should be monitored with port checks?
Anything with a specific TCP port that doesn't speak HTTP: databases such as Postgres, MySQL, Redis, and MongoDB; mail servers using SMTP or IMAP; SSH access; message queues; and custom internal APIs running on non-standard ports. If a service has a defined port and no HTTP health check, it's a candidate for a TCP check—ideally paired with a protocol-level check for anything business-critical.
Does a successful port check prove a database is healthy?
No. It proves that something accepted a TCP connection on that port—it doesn't confirm that the database is authenticated, responsive, or able to run queries. For real confidence, pair the port check with an authenticated connection or a lightweight query, especially for services in your critical request path.
Should I use ping monitoring at all if port monitoring is more specific?
Yes, for infrastructure without a specific service to check—such as routers, VPN gateways, or load balancers where you just need a basic reachability signal. Treat a failed ping as a prompt to check further, not as proof of a network outage, since ICMP filtering can produce the same result as an actual outage.
How often should I check non-HTTP services?
For anything in your critical request path—primary databases and cache layers—30 to 60 second intervals are reasonable given how quickly downstream failures cascade. For less critical internal services, a longer interval such as 2–5 minutes is usually fine and keeps noise down. Base the exact number on your own SLOs and how expensive a short outage actually is for that service.