
From Cron to Confidence: A Failure-Proof Job Monitoring Workflow
See how a team built a reliable cron job monitoring workflow with heartbeat checks, smarter alerts, and on-call processes that catch failures fast.
From Cron to Confidence: A Cron Job Monitoring Workflow That Actually Works
A practical, UK-focused look at how one team went from silent job failures to a cron job monitoring workflow they actually trust — with a working heartbeat monitoring example, an audit template, and an escalation policy you can steal.
A cron job monitoring workflow you can trust comes down to three things: auditing every scheduled task so nothing runs invisibly, instrumenting heartbeat checks so silence is treated as a failure signal, and routing job failure alerts into an on-call process people actually believe in. Get those three right, and you stop finding out about broken jobs from angry customers three days later. I want to be honest upfront, though — no workflow makes job failures impossible. What this approach does is shrink the gap between “something broke” and “someone knows,” from days down to minutes, and that gap is where most of the pain lives.
I want to walk you through how one team got there — not through a fancy overhaul, but through a slow, slightly painful realisation that their “it’ll probably be fine” approach to scheduled jobs was quietly costing them money and sleep. If you’re running cron jobs, Kubernetes CronJobs, Celery beat tasks, or scheduled Lambdas and you’ve ever thought “wait, when did that last actually run?” — this one’s for you.
A quick note before we dive in: the team below, which I’m calling Team Halcyon, is a composite drawn from patterns I’ve seen across several SaaS companies rather than a single named business. The numbers are illustrative rather than audited figures from one specific company, and I’ve flagged them as such throughout.
Why Cron Jobs Fail Without Notice
Team Halcyon is a mid-sized SaaS company — the kind with maybe 30 engineers, a healthy customer base, and, like most growing products, a sprawling collection of scheduled jobs nobody had fully mapped out. Nightly billing exports. Weekly report generation. Hourly data syncs between their app and a third-party CRM. Cleanup scripts that trim old logs and temporary files. Individually, none of these felt like a big deal. Collectively, they were running dozens of unsupervised processes across servers, containers, and serverless functions.
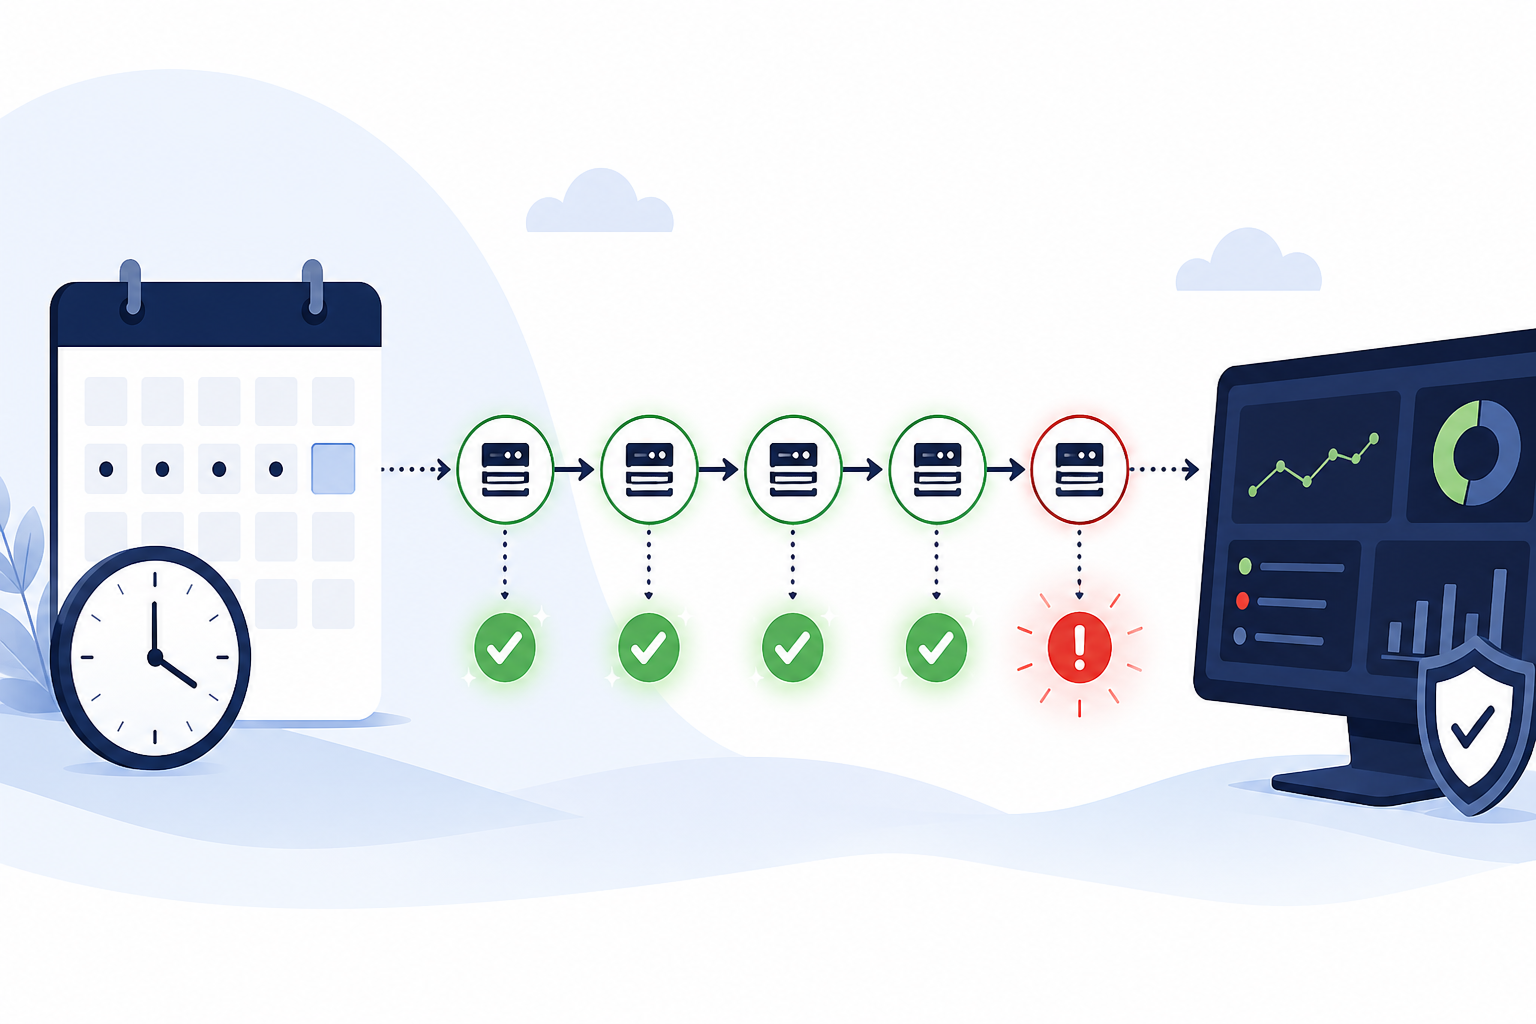
Here’s the thing about cron that catches almost everyone eventually: it doesn’t fail loudly. A job that’s supposed to run and doesn’t just… doesn’t run. There’s no stack trace, no error email, and no red banner. The absence of output looks exactly like a quiet Tuesday. That’s the core problem with relying on cron alone — it was built to schedule execution, not to guarantee or report on it.
Team Halcyon learned this the hard way. Their nightly billing reconciliation job — the one that matched payment gateway records against internal invoices — silently stopped running for four days. Here’s what actually happened, based on the kind of root-cause trail these incidents usually leave: during a server migration, the crontab entry was recreated on the new host, but a typo in the schedule string meant the job silently failed to register at all. No error was thrown because nothing tried to run it. It sat in a spreadsheet-based “migration checklist” as ticked off, because someone confirmed the file had moved, not that the job was actually executing. Nobody owned that specific line item after the engineer who wrote it moved teams. It was finance who eventually flagged a pile of mismatched invoices, and only then did an engineer trace it back to the disabled entry.
What makes this so common is that “check the logs” works fine when you have five jobs and one engineer who knows all of them by heart. It gets shakier at 50 jobs across three services and a team where ownership has shifted twice since the job was written. Nobody’s being lazy — the system just doesn’t scale. And the emotional cost is real too: engineers start dreading Monday mornings because who knows what broke silently over the weekend. On-call becomes reactive firefighting instead of steady maintenance, and trust erodes both internally, between teams, and externally, with customers who notice before you do.
If you’re based in the UK, there’s an extra wrinkle worth naming: a lot of scheduled jobs run overnight in UTC or GMT/BST, which means failures often surface right as the on-call rota hands over at the start of the working day — exactly when nobody wants to be untangling four days of silent drift before their first coffee.
How to Audit Every Scheduled Task for Monitoring Gaps
Team Halcyon’s turnaround started with something almost embarrassingly simple: a spreadsheet. Before touching any tooling, they did a full audit of every scheduled task across their stack. Here’s the process, step by step, and I’d genuinely recommend running this yourself even if you think you already know what’s running.
- Inventory everything. Cron entries on every server, Kubernetes CronJobs, Celery beat schedules, scheduled Lambda functions, CI/CD pipeline schedules — all of it. Halcyon expected to find around 20 jobs. They found 47. In our experience, teams doing this exercise for the first time typically discover 30–60% more scheduled work than they expected — it’s rarely a small gap.
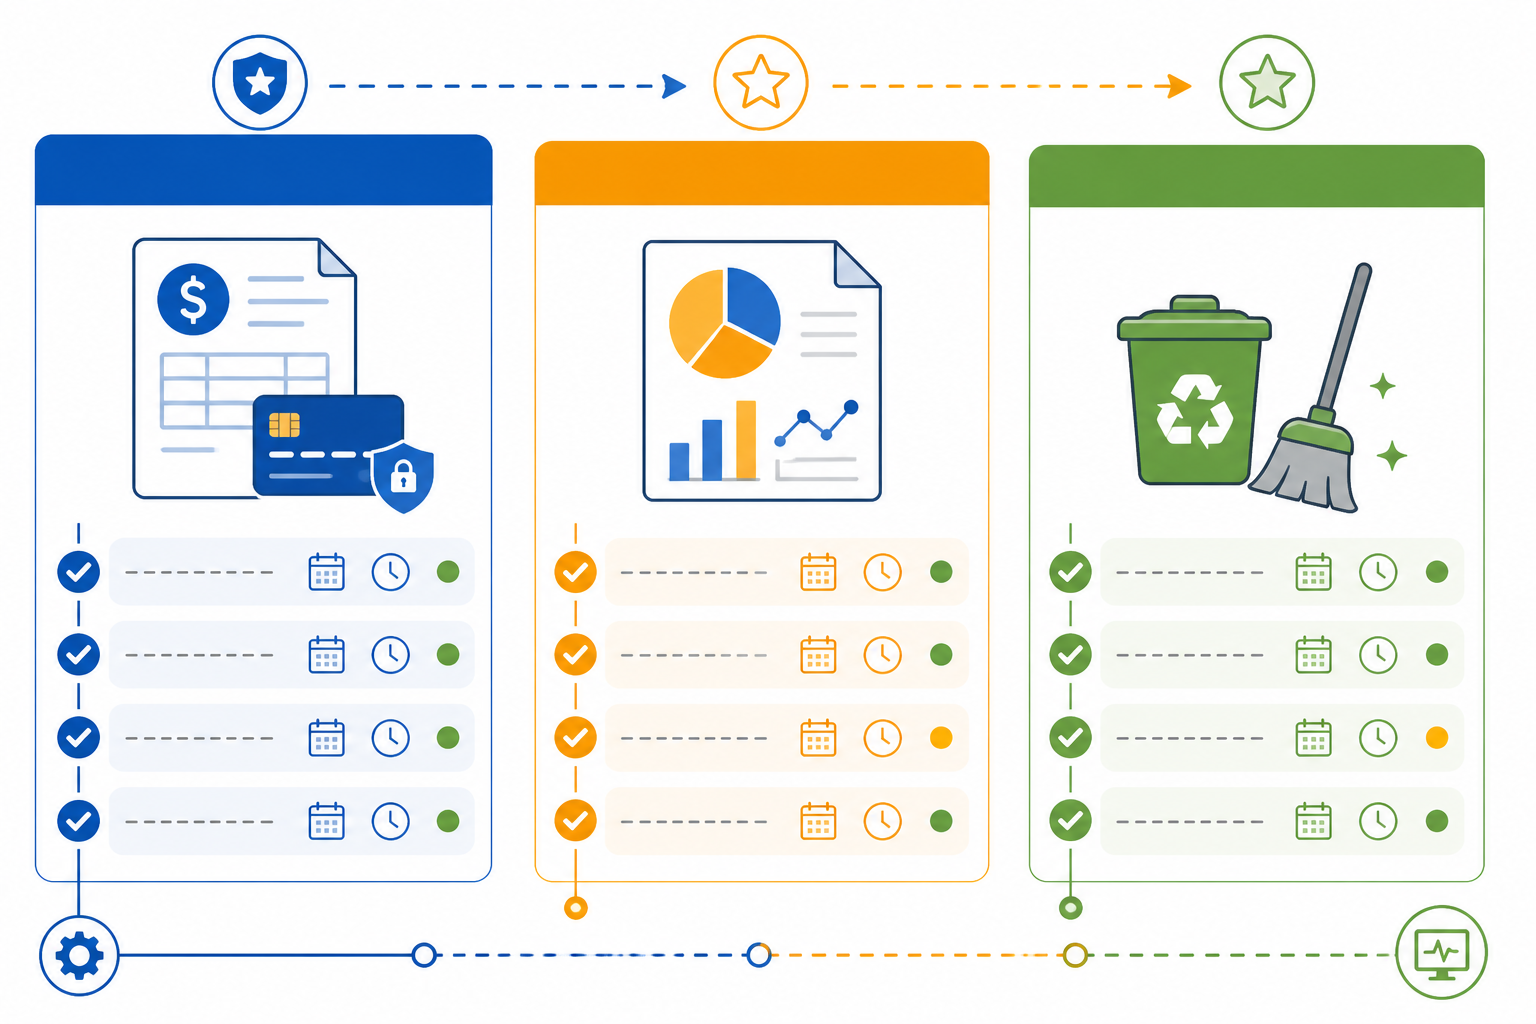
- Classify by business impact. Not every job deserves the same level of attention. Halcyon sorted theirs into three tiers: Critical (billing, payment sync, security scans), Important (report generation, customer-facing data syncs), and Nice-to-Have (log cleanup, cache warming). This single step reframed how they thought about monitoring — critical jobs needed near-instant failure alerts, while nice-to-have jobs just needed a weekly glance.
- Ask the honest question for each job: would we know within minutes if this failed? Not “could we find out eventually if someone dug through logs” — would we actually know, promptly, without manual effort? For most of their 47 jobs, the answer was no.
- Document expected frequency and acceptable delay. A billing job that’s supposed to run nightly at 2am with a 15-minute grace window is a very different monitoring target from a cleanup script that just needs to run once a day, sometime. This documentation became their monitoring baseline — the reference point every alert would be built against.
- Flag the “someone will notice” jobs. This was the most uncomfortable step. A number of jobs had no logging, no alerting, and their de facto failure plan was “a customer or a colleague will eventually complain.” Naming this out loud was what finally got buy-in from leadership to fix it properly.
Scheduled task monitoring audit template
Here’s a simplified version of the inventory table they ended up with — worth copying as a starting template:
| Job | Owner | Schedule | Tier | Expected duration | Grace period | Alert channel |
|---|---|---|---|---|---|---|
| Billing reconciliation | Payments team | 02:00 UTC daily | Critical | 6 min | 15 min | Phone + Telegram |
| CRM data sync | Growth eng | Hourly | Important | 2 min | 10 min | Slack (business hours) |
| Log cleanup | Platform team | 04:00 UTC daily | Nice-to-have | 3 min | 24 hrs | Weekly digest |
A table like this does two jobs at once: it forces you to answer the ownership question for every row, and it becomes the direct input for the alerting rules you’ll build in the next step.
How Heartbeat Monitoring Works Across the Stack
Once the audit was done, the fix itself was refreshingly unglamorous: heartbeat monitoring.
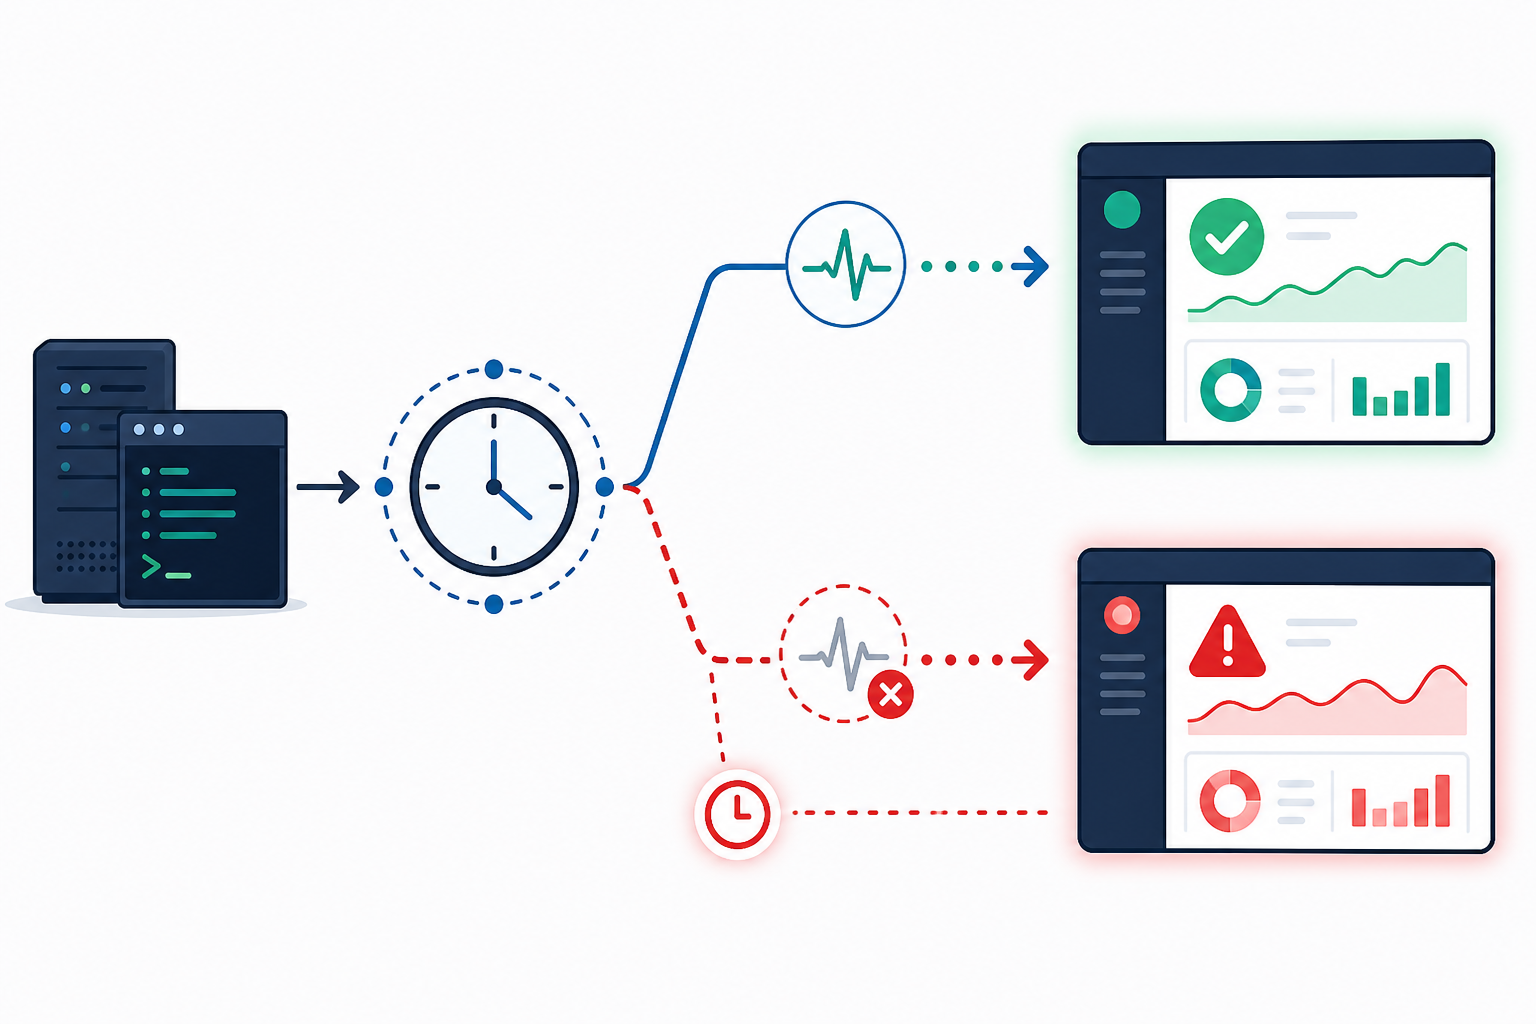
Here’s the concept in plain terms. Instead of monitoring what a job outputs — logs, database rows, files written — you monitor whether the job checks in on schedule. At the end of a script, once it has actually succeeded, you ping a unique monitoring URL. If that ping arrives on time, everything’s assumed fine. If it doesn’t arrive within an expected window, that absence is treated as the failure signal. It’s a small inversion of logic, but it’s useful: instead of trying to catch every possible way a job can go wrong, you watch for the one thing that should reliably happen — a successful check-in — and treat silence as the alarm.
This catches failure modes that log-based monitoring misses. A crashed process doesn’t write an error log — it just stops. A crontab entry disabled during a server migration doesn’t throw an exception — it simply never runs again. A container that fails to start because of a bad deploy doesn’t generate output to grep through. Heartbeat monitoring catches all of these because it doesn’t care why the job didn’t run — only that it didn’t check in when it should have.
Where heartbeat monitoring falls short
It’s worth being precise here, because this is where the concept gets oversold. A heartbeat proves that your script reached the line where the ping was sent — nothing more. If you ping unconditionally, even after a partial failure, you get false confidence: the monitor is green, but the job silently processed 40% of records and quit early. Three things matter to avoid this:
- Ping only on verified success, ideally after checking that the expected side effect actually happened — rows written, file uploaded, records matched — not just that the script exited without an exception.
- Use separate start and success signals for long-running jobs. A “start” ping combined with a maximum expected duration lets you catch jobs that hang partway through, rather than just jobs that never start at all.
- Treat heartbeat monitoring as one layer, not the whole system. It tells you a job ran on schedule. It doesn’t tell you the output was correct. Pair it with occasional data-quality checks on critical jobs — for example, a weekly assertion that reconciled invoice totals match payment gateway totals within a tolerance.
A minimal cron heartbeat implementation
Here’s roughly what a success-only heartbeat looks like in a shell script wrapping a billing job:
#!/usr/bin/env bash
set -euo pipefail

## Run the actual work first
python run_billing_reconciliation.py

## Only ping if the line above succeeded (set -e will have
## already exited the script on failure, so we never reach this)
curl -fsS -m 10 --retry 2 \
  "https://heartbeat.example.com/ping/${HEARTBEAT_TOKEN}" > /dev/null
A few details that matter in practice: the -m 10 timeout stops a slow network call from hanging the job itself; --retry 2 handles a flaky connection without treating it as a job failure; and the token lives in an environment variable, not hard-coded in the script, so it doesn’t end up committed to a repo or logged in plaintext (worth flagging for teams thinking about UK GDPR obligations — heartbeat payloads should never carry customer data, just a token and a timestamp).
Halcyon used a monitoring tool with a purpose-built cron and heartbeat monitor type for this, mainly to avoid building and maintaining their own ping-tracking service. That’s a reasonable choice for most teams — building this in-house is solvable but rarely worth the maintenance cost. Whichever tool you choose, the two things worth checking are: does it verify failures from more than one location before alerting, so a brief network blip at your monitoring provider doesn’t page someone unnecessarily, and does it let you set an asymmetric grace period, since job runtimes are rarely perfectly consistent?
On that note: if your nightly sync usually finishes in 8 minutes but occasionally takes 14 during high load, setting your alert threshold at 10 minutes guarantees false alarms. Halcyon set grace periods based on observed runtime variance plus a comfortable buffer, which cut noisy alerts almost immediately — in their case, from roughly a dozen false pages a month down to one or two.
They also didn’t try to instrument all 47 jobs in one sprint — that’s a fast way to burn out a team and half-configure everything. Critical jobs got heartbeats first, in week one. Important jobs followed over the next two sprints. Nice-to-have jobs got basic coverage last, once the team had a rhythm for it. Rolling out incrementally meant every heartbeat that went live was actually tuned properly, rather than being noise from day one.
How to Route Job Failure Alerts into On-Call Workflows
Heartbeats alone don’t fix anything if the alerts land in a channel nobody watches. This is where a lot of teams stall — they instrument the monitoring, then treat alert routing as an afterthought. Halcyon built this part deliberately, with an explicit severity-to-channel matrix:
| Tier | Channel | Acknowledge within | Escalation |
|---|---|---|---|
| Critical | Phone call + Telegram, 24/7 | 5 minutes | Auto-escalates to secondary on-call, then team lead |
| Important | Slack channel, business hours | 30 minutes | Escalates to channel owner if unacknowledged |
| Nice-to-have | Weekly digest, no real-time ping | N/A | Reviewed in weekly ops sync |
A few specifics that made this actually work, rather than just look good on paper:
- Route by severity, not by default. Critical job failures went straight to phone and Telegram alerts for the on-call engineer, day or night. Important job failures went to a dedicated Slack channel monitored during business hours. Nice-to-have failures went to a low-priority channel, reviewed weekly.
- Set acknowledgement timeouts and real escalation paths. If the primary on-call engineer doesn’t acknowledge a critical alert within five minutes, it escalates automatically to a secondary, then to a team lead. This matters especially around UK bank holidays and annual leave — Halcyon keeps an explicit rota with named cover, rather than assuming “someone” will pick it up.
- Deduplicate and suppress known noise. A single underlying incident shouldn’t repage the same person every two minutes. Alerts get grouped by incident, and known maintenance windows suppress alerts temporarily rather than generating a flood the moment a planned deploy starts.
- Set up a status page for visibility without interruption. Halcyon built a status page so internal stakeholders — and for some jobs, customers — could check incident history themselves instead of pinging engineering every time something looked off.
- Write a lightweight incident response runbook. Nothing elaborate — just a short doc answering “what do I check first when this specific heartbeat monitor goes red?” for each critical job. This turned panicked 2am troubleshooting into a five-minute checklist.
- Use webhooks for known, well-understood failure patterns. For a handful of jobs with recurring failure modes, webhook integrations automatically created a ticket or triggered a safe retry before a human even needed to look at it.
- Assign clear ownership per job category. Real-time alerting only works if someone is actually responsible for triage. Halcyon assigned an owner per job tier rather than dumping everything into one shared, ownerless queue — which had been the root of a lot of earlier confusion about who was supposed to act.
Results: Better Scheduled Task Reliability and Faster Fixes
A caveat before the numbers: these figures are illustrative, drawn from the kind of before-and-after pattern we consistently see when teams implement this workflow, rather than a single audited data set. Treat them as a realistic scenario rather than a scientific benchmark.
| Metric | Before | After |
|---|---|---|
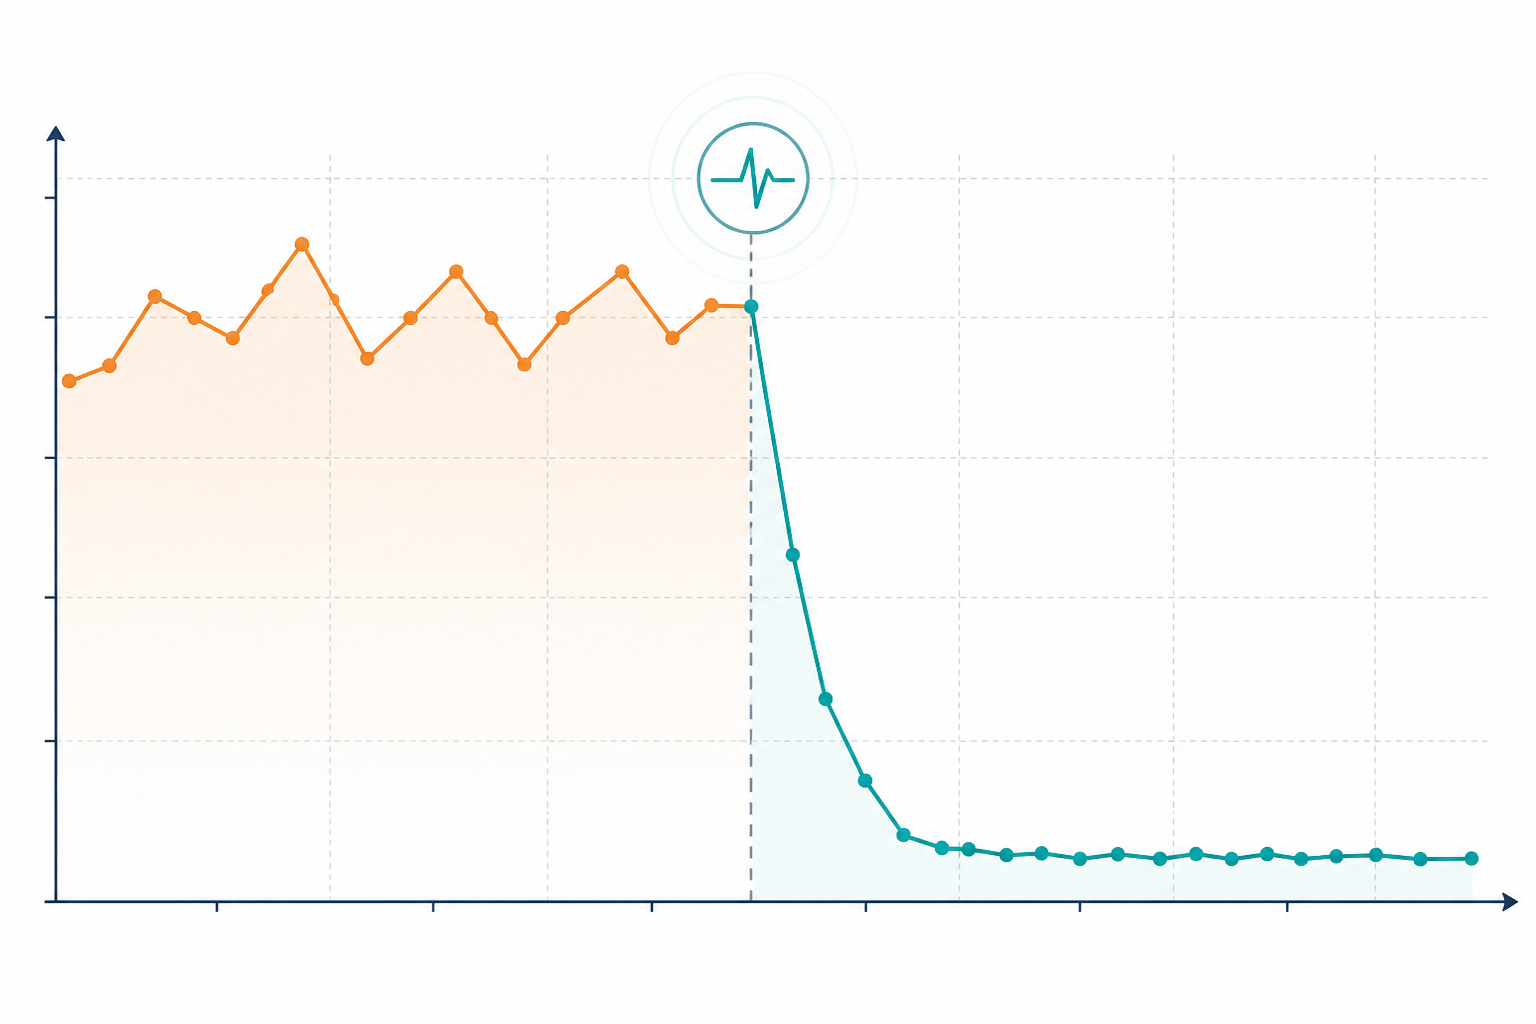
| Mean time to detect a failed critical job | 2–4 days | Under 5 minutes |
| False-positive alerts per month | ~12 | 1–2 |
| Critical jobs with active monitoring | 0 of 8 | 8 of 8 |
| “Is this broken?” Slack messages per week | ~15 | ~3 |
On-call stopped being something people dreaded. Monday mornings used to mean sifting through a weekend’s worth of silent failures and guessing what needed fixing first. Now, if nothing pinged over the weekend, that actually meant nothing broke — a small thing, but it changed the whole tone of the week.
Incident history and response-time data gave the team something they hadn’t had before: evidence. Instead of arguing from gut feeling about which parts of the infrastructure needed investment, they could point to a dashboard showing which jobs failed most often and why. That turned into real conversations about fixing root causes — flaky third-party APIs, undersized worker containers — rather than just patching symptoms every time something broke.
It’s worth being honest about what this didn’t fix, too. Heartbeat monitoring told them a job ran, not that its output was correct — Halcyon still had one incident where a sync job pinged successfully but wrote incomplete data because of an upstream API returning a partial response with a 200 status. That gap is why the data-quality checks mentioned earlier ended up on their roadmap as a second layer, not a replacement for heartbeats but a companion to them.
Maybe the biggest shift was cultural. Scheduled task reliability stopped being a vague feeling — “I think the syncs are fine?” — and became something visible and measurable. Leadership could glance at uptime trends the same way they’d check any other product metric. And monitoring stopped being extra work bolted on after the fact — it became a normal part of shipping any new scheduled job, the same way writing a test is just part of shipping any new feature.
FAQ: Cron Job Monitoring and Incident Response
How do I audit all my scheduled jobs for monitoring gaps? Start with a full inventory — cron entries, CI/CD scheduled pipelines, Kubernetes CronJobs, serverless scheduled functions — then classify each by business impact. For every job, ask whether you’d know within minutes if it silently stopped running. If the honest answer is “no” or “eventually,” that’s your gap list, and it’s usually longer than teams expect. See the audit table above for a starting template.
What does a complete cron job monitoring workflow look like? A complete workflow has three layers: heartbeat checks that confirm each job actually ran and succeeded on schedule, alerting rules that route failures to the right person through the right channel based on severity, and a documented incident response process — including escalation and acknowledgement timeouts — so alerts turn into fast fixes instead of confusion. Add a status page and incident history, and you’ve got a feedback loop for improving reliability over time.
How do other teams structure their on-call for job failures? Most mature teams tier their jobs by impact first — critical revenue or customer-facing jobs get paged immediately with automatic escalation if unacknowledged, while lower-priority jobs go to a Slack channel reviewed during business hours. Ownership is assigned per job category rather than dumping everything on one rotation, and holiday or leave cover is planned explicitly rather than assumed, which keeps alert fatigue down and makes sure critical failures never get lost in the noise.
How do I configure a heartbeat without creating false positives? Set your grace period based on observed runtime variance, not the average — if a job usually takes 8 minutes but occasionally takes 14, your threshold needs to comfortably clear the slow runs. Ping only after verified success rather than unconditionally, use multi-region failure verification where available so a brief network blip doesn’t trigger a false alarm, and revisit thresholds periodically as job behaviour changes. See the “minimal cron heartbeat implementation” section above for a working pattern.
If any of this sounds a little too familiar — a spreadsheet you’ve been meaning to make, a job you’re pretty sure still runs but haven’t checked in weeks — that’s usually the sign it’s worth an afternoon of auditing. It’s rarely as painful as it sounds, and it’s a lot less painful than the alternative.