
The True Cost of Downtime for SaaS Businesses: A Breakdown and Formula
Learn how to calculate the true cost of downtime, from lost sales to churn, and reduce SaaS downtime with faster detection and a clear status page.
The cost of downtime is more than the revenue you miss while your app is offline. It adds up lost sales, extra support work, SLA credits, possible churn and damaged trust. The good news is that you can estimate it with a simple formula using your own numbers, then bring it down by detecting failures faster and communicating openly through a public status page. We'll do exactly that in this post, step by step.
Why downtime costs more than the headline number ☕
Picture a Tuesday afternoon. Your API starts returning errors at 2:10pm. Nobody on the team notices, because nothing is obviously on fire: the website loads, the dashboards look fine, and everyone is heads-down on the roadmap. At 2:50pm a customer emails to ask whether something's wrong. By 3:15pm there are six tickets, a worried message from a key account in your shared Slack channel, and two engineers who've dropped everything to dig through logs.
When the fix goes out at 4:00pm, most people would say you had about 110 minutes of SaaS downtime. But what did it really cost? Probably not just the sales you missed. There was the support backlog, the lost afternoon of engineering focus, the awkward follow-up with that key account, and the quiet question in a few customers' minds about whether you're reliable.
Most people only count lost revenue per minute, because it's the easiest number to calculate. It's often the smallest part of the bill, and the slower costs like credits, churn and reputation are much easier to overlook.
I'll be upfront about one thing: I won't quote industry averages here. Your cost depends on your business model, your customer mix and what your contracts promise, and a figure borrowed from someone else's company is a guess wearing a suit. Instead, we'll break the cost into direct, hidden and longer-term pieces, and then I'll give you a formula you can use today with your own numbers.
Direct revenue lost per minute of SaaS downtime
Let's start with the part everyone thinks about. For an e-commerce shop, every minute offline roughly equals missed orders. SaaS is more nuanced. A customer paying monthly doesn't stop paying because your app was down for 20 minutes. What you might lose is subtler: trial conversions, upgrades, new sign-ups and some usage-based billing.
Which revenue is lost, delayed or recovered?
Here's the catch: not everything you miss is gone for good. Some of it is only delayed, and you should only count the portion you realistically don't expect to get back.
- Self-serve sign-ups and trial starts: a visitor who hits an error often doesn't return, but some will try again later. Estimate how many do.
- Checkout and upgrade flows: intent is high and patience is low, so a share of these will be lost. Others will complete once you're back.
- Usage-based charges: if usage simply doesn't happen, nothing is billed. If customers queue their work and run it afterwards, the revenue is deferred, not lost.
- API calls billed per request: requests that fail and are retried successfully later may still be billed. Requests that are abandoned are not.
Monthly subscriptions and annual contracts aren't lost minute by minute. But they can turn into refund requests, goodwill credits or SLA obligations, so they belong in the formula on a different line.
Why timing matters when estimating lost revenue
A sign-up page outage during a campaign launch costs far more than a quiet Sunday night wobble. Open your analytics and look at hourly sign-ups, trial starts and usage. Find your typical hour and your peak hour, and you'll have two numbers to plug into the formula later.
Hidden costs of SaaS downtime: support, churn and trust
This is where the iceberg sits. Lost revenue is the visible tip, and everything else is underwater.
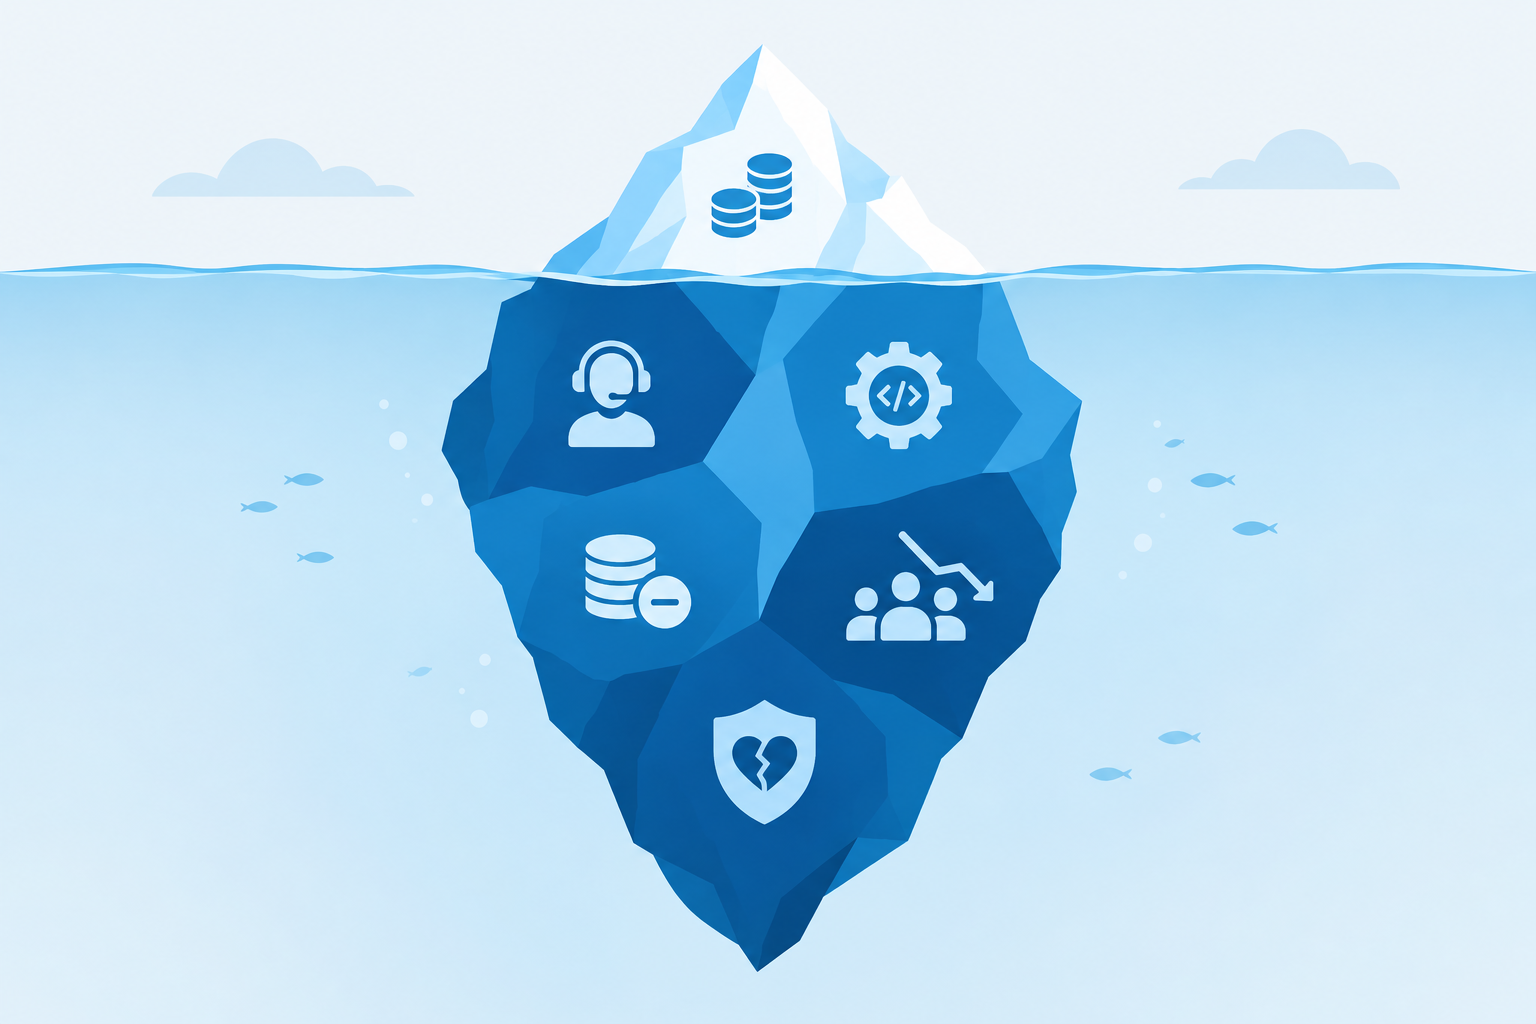
Here's what typically hides below the surface:
- Support load: tickets, live chat spikes and replies to "is it just me?" messages. Every one takes someone's time, and many are near-identical.
- Engineering time: incident response, the post-mortem and the context-switching afterwards. Someone pulled off a roadmap task doesn't slot back in instantly, so the real cost outlasts the incident.
- SLA credits and refunds: if your contracts promise a specific uptime percentage, breaching it can trigger credits. Even without formal SLAs, many teams offer goodwill refunds.
- Churn: customers rarely leave after a single outage. What tips them over is repeated incidents, long outages and poor communication, the sense that nobody is in control.
- Trust and sales friction: enterprise buyers and procurement teams often ask about uptime history. A patchy record, or vague answers in a security questionnaire, can slow or sink a deal.
Churn deserves extra care because it's the line most likely to be exaggerated. Not every customer who leaves after an incident left because of it, so what you want is the additional churn the incident caused, beyond what you'd normally expect. The best evidence is your own data: compare retention among customers affected by incidents with comparable customers who weren't. Until you have that, use a cautious estimate and label it as one.
How to calculate the cost of downtime: a simple formula
Time to get practical. You don't need a finance degree or a perfect dataset, just five steps and a calculator.
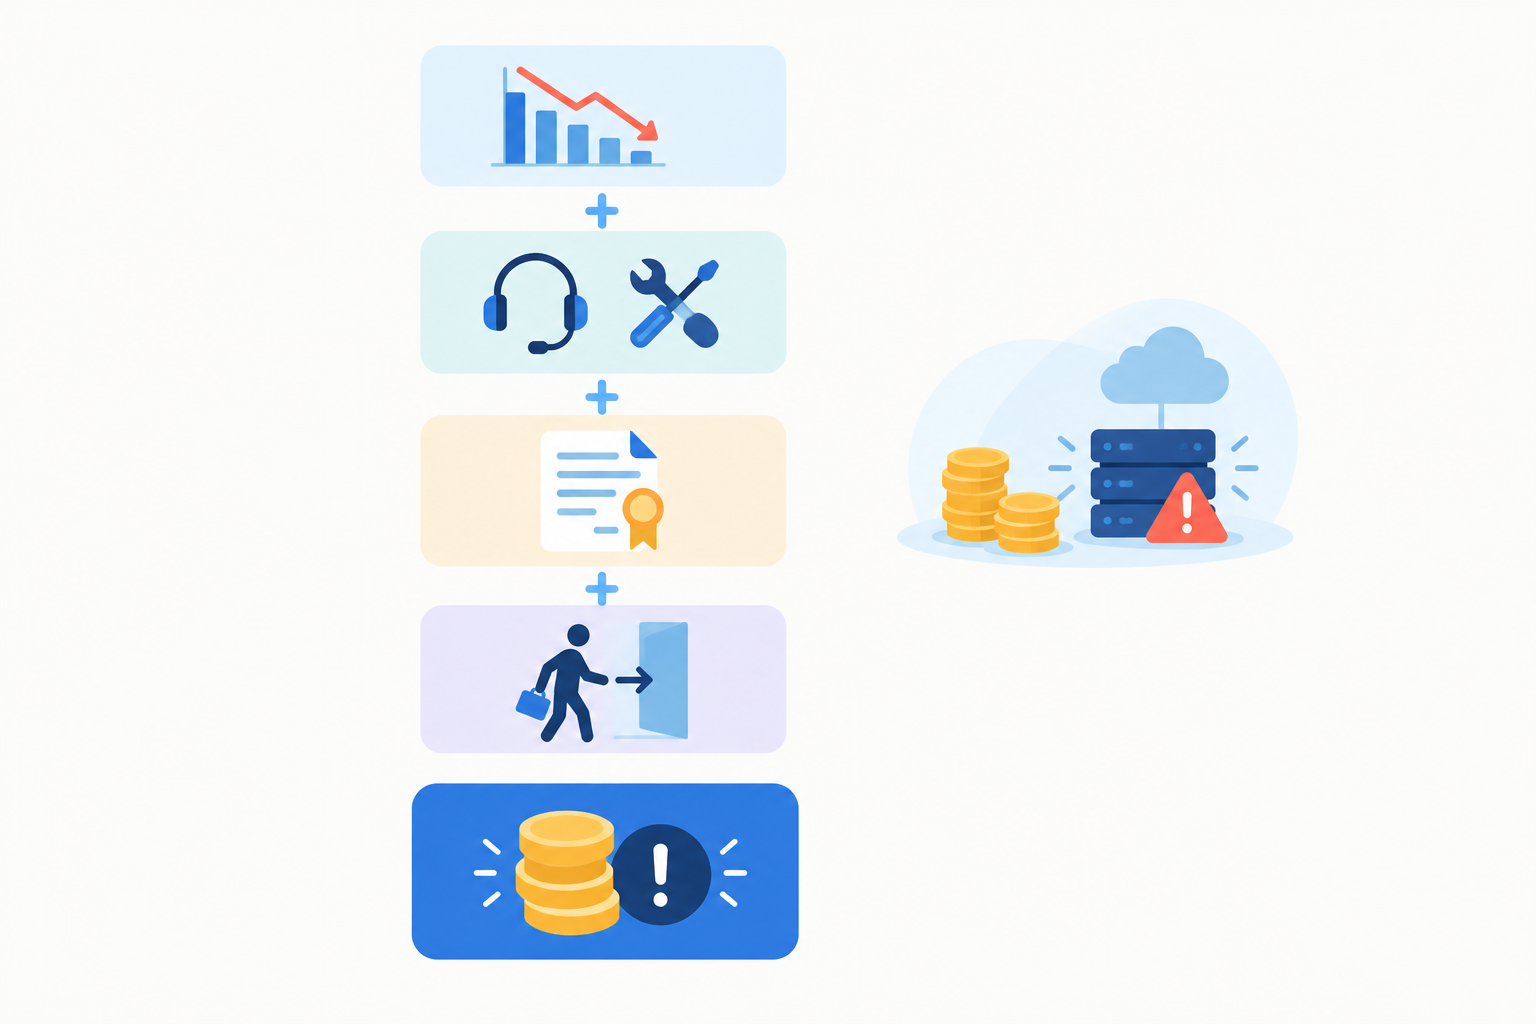
- Estimate unrecovered direct revenue loss. This is the revenue that depends on your app being up (sign-ups, upgrades, usage-based billing, per-request charges), minus the portion you expect customers to make up afterwards. Use your hourly average, or your peak-hour figure if the outage lands in busy time.
- Add support and engineering cost. Calculate people involved × hours spent × loaded hourly cost, in pounds. "Loaded" means salary plus employer costs and overheads, not just take-home pay.
- Add contractual cost. Include any SLA credits, refunds or service credits the outage triggers.
- Add expected incremental churn loss. Calculate customers affected × additional churn probability caused by the incident × expected gross profit per customer over their remaining lifetime. Gross profit (or contribution margin) is a fairer measure than revenue-based lifetime value, because revenue isn't what you lose when a customer leaves; the margin is.
- Total the cost per incident. Add steps 1 to 4 together. Multiply by your expected incidents per year for an annual figure.
A quick word on step 4: it's the least certain input by a long way. Treat it as a scenario, not a fact, and show your workings both with and without it.
A worked example using hypothetical numbers
Let's imagine a B2B platform with usage-based charges and a handful of SLA customers. These figures are invented purely to show the method. They aren't benchmarks, and your numbers will differ.
Suppose a one-hour outage happens on a weekday afternoon:
- Unrecovered direct revenue: £400 in usage-based charges and missed sign-ups, after allowing for work customers re-run later
- Support and engineering: 4 people × 3 hours × £45 loaded hourly cost = £540
- Contractual cost: £600 in SLA credits
- Incremental churn: 200 affected customers × 0.5% additional churn × £3,000 expected gross profit per customer = £3,000
Total for the incident: £4,540.
Now see how much that churn assumption matters. If the extra churn is only 0.25%, the churn line drops to £1,500 and the total to £3,040. If you exclude churn entirely, you're left with a firmer £1,540, in which direct revenue is about a quarter of the cost rather than under a tenth. Showing the range, from the cautious floor to the scenario with churn, is more honest and more convincing than a single dramatic figure.
Start with rough estimates, then refine them
Don't wait for perfect data. Run the formula with estimates today, then improve it after each incident. A simple spreadsheet with one row per incident works well: start time, detection time, duration, people involved, credits issued, and any affected customers who later churned or complained. Over a few months you'll replace guesses with real numbers.
What does an hour of SaaS downtime really cost?
Honestly? It depends. Anyone quoting a single universal figure for an hour of downtime is guessing. To show how far the answer can swing, here are two hypothetical companies, illustrative only:
| Self-serve tool, monthly plans | B2B platform, annual contracts and SLAs | |
|---|---|---|
| Unrecovered direct revenue | £150 | £400 |
| Support and engineering | £140 (2 people × 2 hours × £35) | £540 |
| SLA credits | £0 | £600 |
| Incremental churn | £180 (2,000 customers × 0.1% × £90 gross profit) | £3,000 |
| Total | about £470 | about £4,540 |
Same outage length, very different answers. What moves the number most is customer size and value, contract terms, time of day, and how long customers wait for information.
Duration matters too, though not in a tidy straight line. Support time and lost sign-ups tend to climb as an outage drags on, while SLA credits often depend on contractual thresholds, and some costs are fixed however quickly you fix things. As homework, run the formula for a 15-minute, 1-hour and 4-hour outage and put the numbers side by side. It's usually eye-opening.
How faster detection reduces the cost of downtime
Look back at the formula. Several lines tend to grow the longer an incident runs: more lost sign-ups, more tickets, more engineering hours and more strain on customers' patience. Others are fixed or threshold-based, like an SLA credit that only applies once you cross a contractual limit. The relationship varies by cost type, but one thing holds: the gap between failure and awareness is the part you have the most control over.
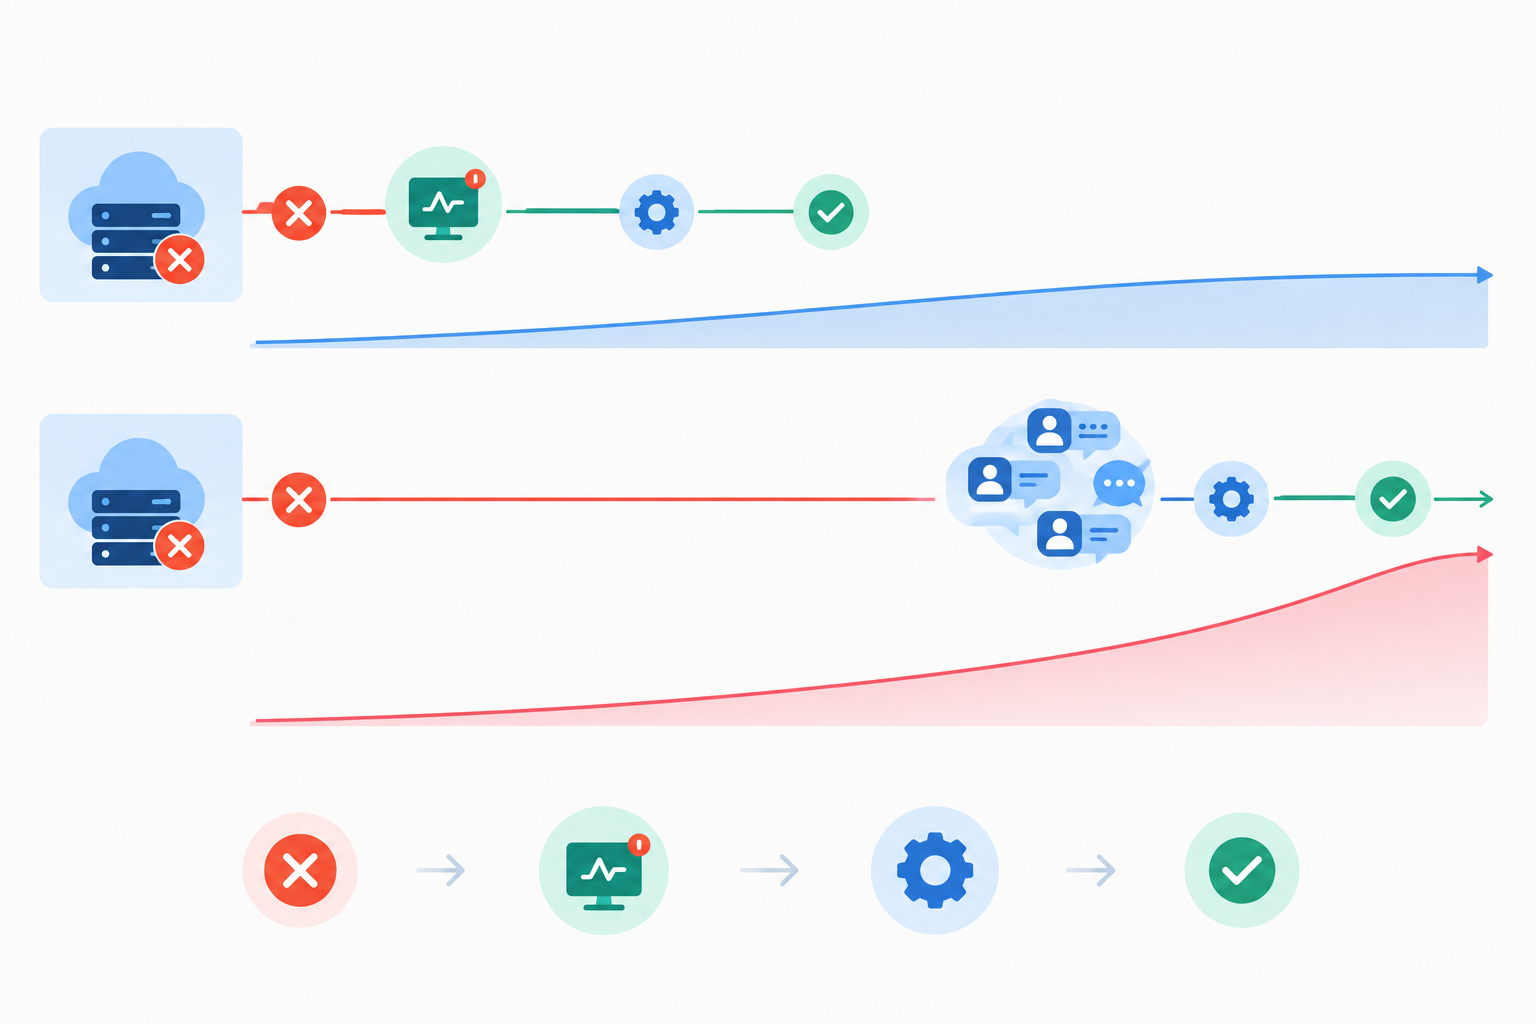
Finding out from customers is the worst way to learn about an incident. By the time that email lands, trust has already taken a hit, and the customer has effectively done your monitoring for you.
Check frequency and false alarms
Shorter check intervals shrink detection time. If you only check every ten minutes, you could be blind for nearly that long before anything fires. But frequent checks only help if you can trust the alerts.
That's where multi-region failure verification comes in. Moonitor confirms a failure from several locations before alerting, so a blip on one network doesn't wake your team at 3am. That protects against alert fatigue, which is its own hidden cost: people stop reacting to alerts that cry wolf.
Monitor more than the homepage
A homepage that loads can hide a lot of trouble. Think about everything your customers depend on:
- API monitoring for the endpoints your customers integrate with, since an API failure often hits paying users first
- Server monitoring and port checks to catch infrastructure-level problems
- Cron job monitoring and heartbeat monitoring for background jobs that fail silently, like invoicing, data syncs and backups
- SSL certificate monitoring and domain expiry checks, which prevent entirely avoidable outages
- DNS monitoring to catch unexpected record changes before they cause chaos
Then send alerts where your team already spends its day: email, Slack, Discord, Telegram or webhooks. A perfectly good alert in an inbox nobody checks is no better than no alert at all.
How quickly should you detect SaaS failures?
Aim for detection measured in minutes, matched to how critical each service is. Look after the customer-facing paths first: sign-up, login, checkout and your core API. Internal tools can tolerate a slower cadence. You don't need to treat everything as equally urgent, just make sure the things that cost you money when they break are watched closely.
What each monitor type protects you from
It helps to connect each monitor type back to the cost categories in our formula.
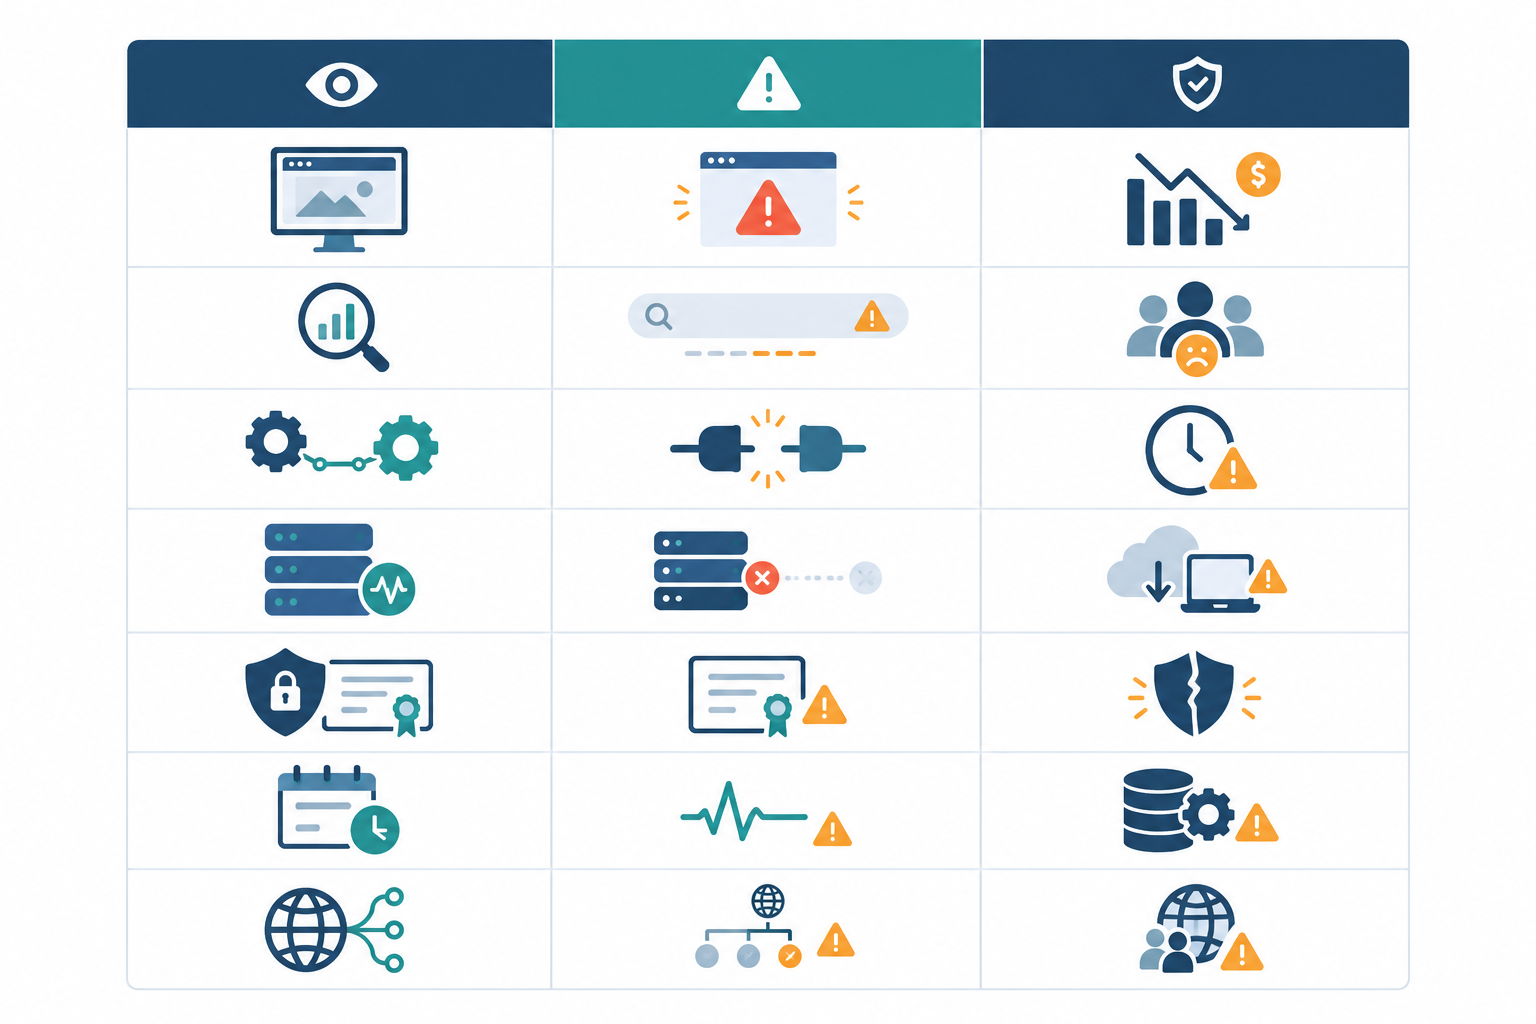
| Monitor type | What it catches | Example hidden cost it prevents |
|---|---|---|
| HTTP/S website monitoring | Site or app returning errors or timing out | Missed sign-ups and a spike of "is it down?" tickets |
| Keyword monitoring | Pages that load but show an error message or missing content | Silent failures where the page is "up" but unusable |
| API monitoring | Failing or slow endpoints your customers rely on | SLA credits and integration customers losing confidence |
| Port and ping | Servers or services not responding at the network level | Long engineering firefights because the root cause was found late |
| SSL and domain expiry | Certificates or domains about to lapse | Avoidable outages and browser warnings that scare customers off |
| Cron/heartbeat monitoring | Scheduled jobs that stop running without any error | Missed invoices, failed backups and data problems discovered days later |
| DNS record change detection | Unexpected or unauthorised changes to DNS records | Hard-to-diagnose outages and email or routing problems |
There's a pattern here: the more silent the failure, the longer it tends to go unnoticed, and the more it can cost by the time someone spots it.
How transparent communication limits downtime damage
Here's something that surprises people about incidents: silence can cost more than the outage itself. When customers hear nothing, they fill the gap with worst-case assumptions. Is my data safe? Have they been hacked? Is anyone even working on this? Then they flood your support inbox to find out.
A branded public status page gives customers one place to check. Instead of ten people emailing the same question, they see an acknowledgement and an estimated time for the next update. That can deflect tickets, save engineering time and keep frustration from spreading.
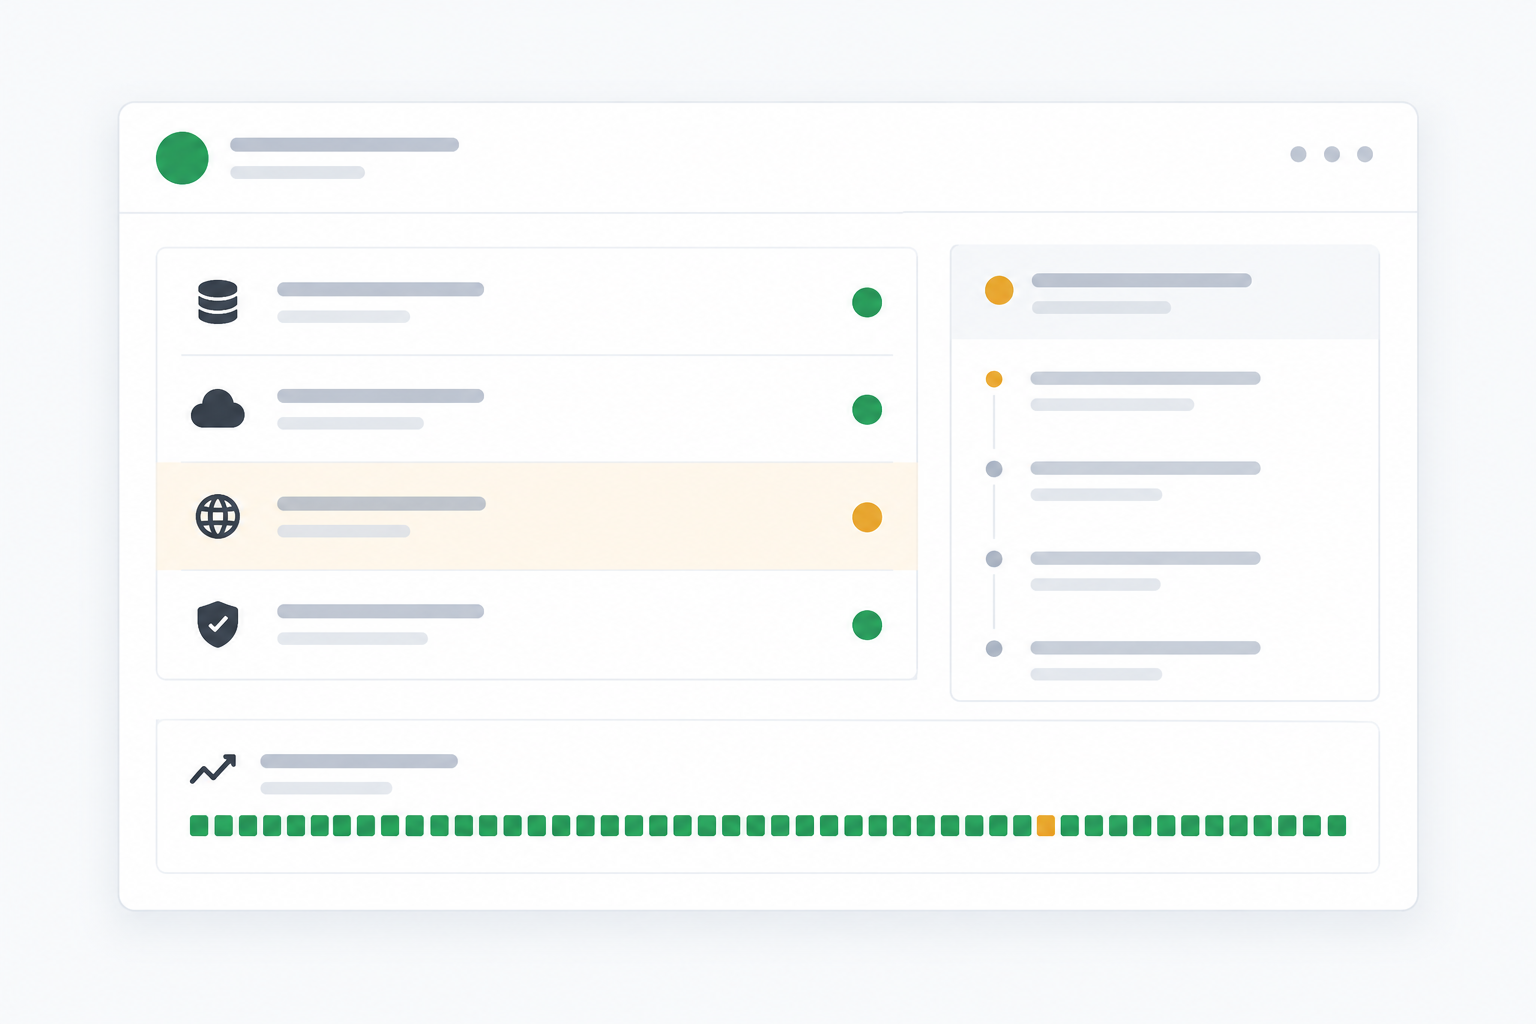
What to publish on your status page
Keep the lifecycle simple and consistent:
- Acknowledged: we know something's wrong
- Investigating: we're looking into the cause
- Identified: we've found the problem and are working on a fix
- Monitoring: a fix is in place and we're watching it
- Resolved: everything is back to normal
Add timestamps to each update and write in plain English. "Our API is returning errors for some customers; we're investigating" beats a paragraph of internal jargon every time.
Principles that build credibility
- Be honest. Don't hide incidents or quietly delete them. Prospects doing due diligence tend to value an honest history over a suspiciously perfect one.
- Use your own domain. A branded status page on your own domain feels more trustworthy than a generic third-party link, and it looks like part of your product.
- Let incident history work for you. Over time, a record of quickly resolved incidents shows reliability in practice, which can help with enterprise buyers and procurement checks.
Moonitor's status pages and incident history sit alongside monitoring, so the updates you publish can be tied to what was actually detected rather than reconstructed from memory.
A hypothetical example
Imagine a customer who emails, clearly annoyed, because their integration has stopped working. They've already seen an update on your status page: "2:25pm: We've identified an issue with our API and are rolling out a fix. Next update by 3:00pm." At 2:55pm they see another: "Fix deployed, we're monitoring." Their follow-up might shift from "what is going on?" to "thanks for the heads-up." It won't win over everyone, and a status page can't make up for a long or repeated outage, but clear updates give frustrated customers less reason to assume the worst.
Use your downtime cost estimate to make the case for monitoring
Once you've run the formula, you have an annual downtime cost estimate. Multiply your cost per incident by the number of incidents you expect each year, then compare that with what monitoring costs and the time it saves. Show the range, with and without churn, and a finance lead or co-founder has something concrete to weigh up.
On cost, Moonitor starts at $14/mo for 20 monitors on the Solo plan, and goes up to $49/mo for unlimited monitors on Max. Those prices are in US dollars, so if you're in the UK, check the pricing page for how they convert and whether VAT applies. There's a 7-day free trial with no credit card required, and setup is quick, so you can start with your most critical endpoints: your API, your sign-up flow and your login page.
As your cost tracking matures, response-time analytics and the full API with data export let you pull detection and resolution times into your own spreadsheets or dashboards, which makes the incident log we talked about easier to keep.
So here's my gentle nudge: run the formula for your own business this week. Then set up monitors and a status page for your most important services. You'll catch problems sooner, tell customers sooner and spend less time wondering what the last outage really cost.
FAQ
How do I calculate what an outage costs me?
Add together four things: unrecovered revenue that depends on your service being up, the staff time spent on support and recovery, any SLA credits or refunds, and an estimate of the extra churn the incident caused, valued at expected gross profit rather than full revenue. Use your own data and treat the first result as a rough estimate you'll refine after each incident.
How does downtime affect churn?
One short, well-communicated outage rarely causes customers to leave. Repeated incidents, long outages and poor communication are what push them away. To understand your own risk, compare churn among customers affected by incidents with comparable customers who weren't.
How fast should I detect failures?
As fast as the importance of the service justifies. For customer-facing pages and APIs, aim to be alerted within minutes rather than hearing about it from users. Multi-region verification helps make sure those alerts are real rather than false alarms.
Do small SaaS businesses really need a public status page?
Often, yes. A status page can reduce repetitive support tickets during an incident and shows customers you're open about reliability, which matters when you're still building trust.
Can monitoring prevent downtime entirely?
No. Monitoring can't stop every failure, but it shortens the time to detect and fix issues, and it can help you avoid preventable ones such as expired SSL certificates, lapsed domains or silently failing cron jobs.