
White-Label Status Pages: How Agencies Use Branded Reporting to Impress Clients and Boost Retention
Learn how a white-label status page helps agencies build client trust, show monitoring value, support retention and create upsell opportunities.
White-Label Status Page Strategies for Agencies: Build Trust, Retain Clients and Show Value
A white-label status page lets your agency show clients real-time uptime, incident history and performance data under your own branding instead of a third-party monitoring tool's name. If you manage hosting, maintenance or ongoing support retainers for multiple clients, a branded status page for agencies is one of the most tangible ways to show the work happening behind the scenes. It's the kind of work that's easy to deliver and surprisingly hard to describe in a monthly email.
If you've ever sat across from a client trying to explain why their retainer is worth it, you know how hard it is to make "we've been keeping an eye on things" sound like real work. A status page doesn't replace that conversation, but it gives you something concrete to point to during it: a live record instead of a vague reassurance.
Why client-facing status pages matter for agencies
Let's look at how most agencies currently handle uptime reporting: a quick Slack message when something breaks, perhaps a monthly email recap if someone remembers, and a lot of "trust us, we're on it." It works, sort of. But it leaves no lasting record. Six months later, when renewal time rolls around, the client doesn't remember the three times you caught something before it became a problem. They just remember paying an invoice.
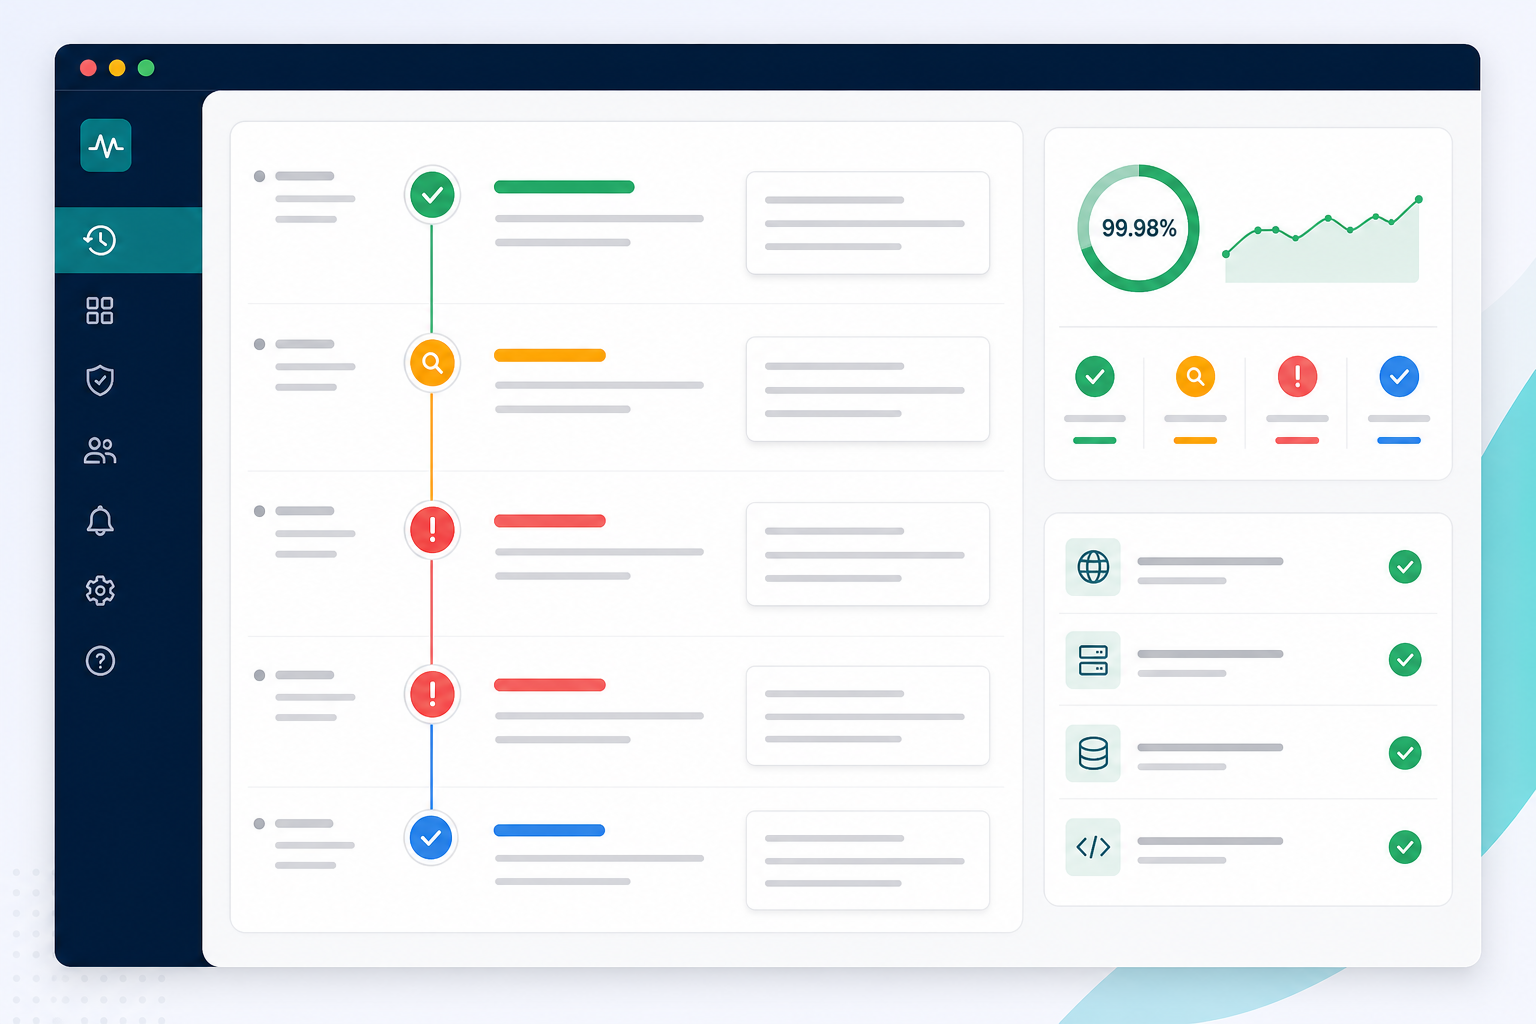
Here's a simple before-and-after. Ad-hoc version: "Hey, just a heads up, the site had a hiccup this morning, all good now." Status-page version: an incident history showing detection at 09:14, acknowledgement at 09:16, resolution at 09:41, with a plain-language note on the cause and fix. Same event, two very different impressions of how well things are being managed.
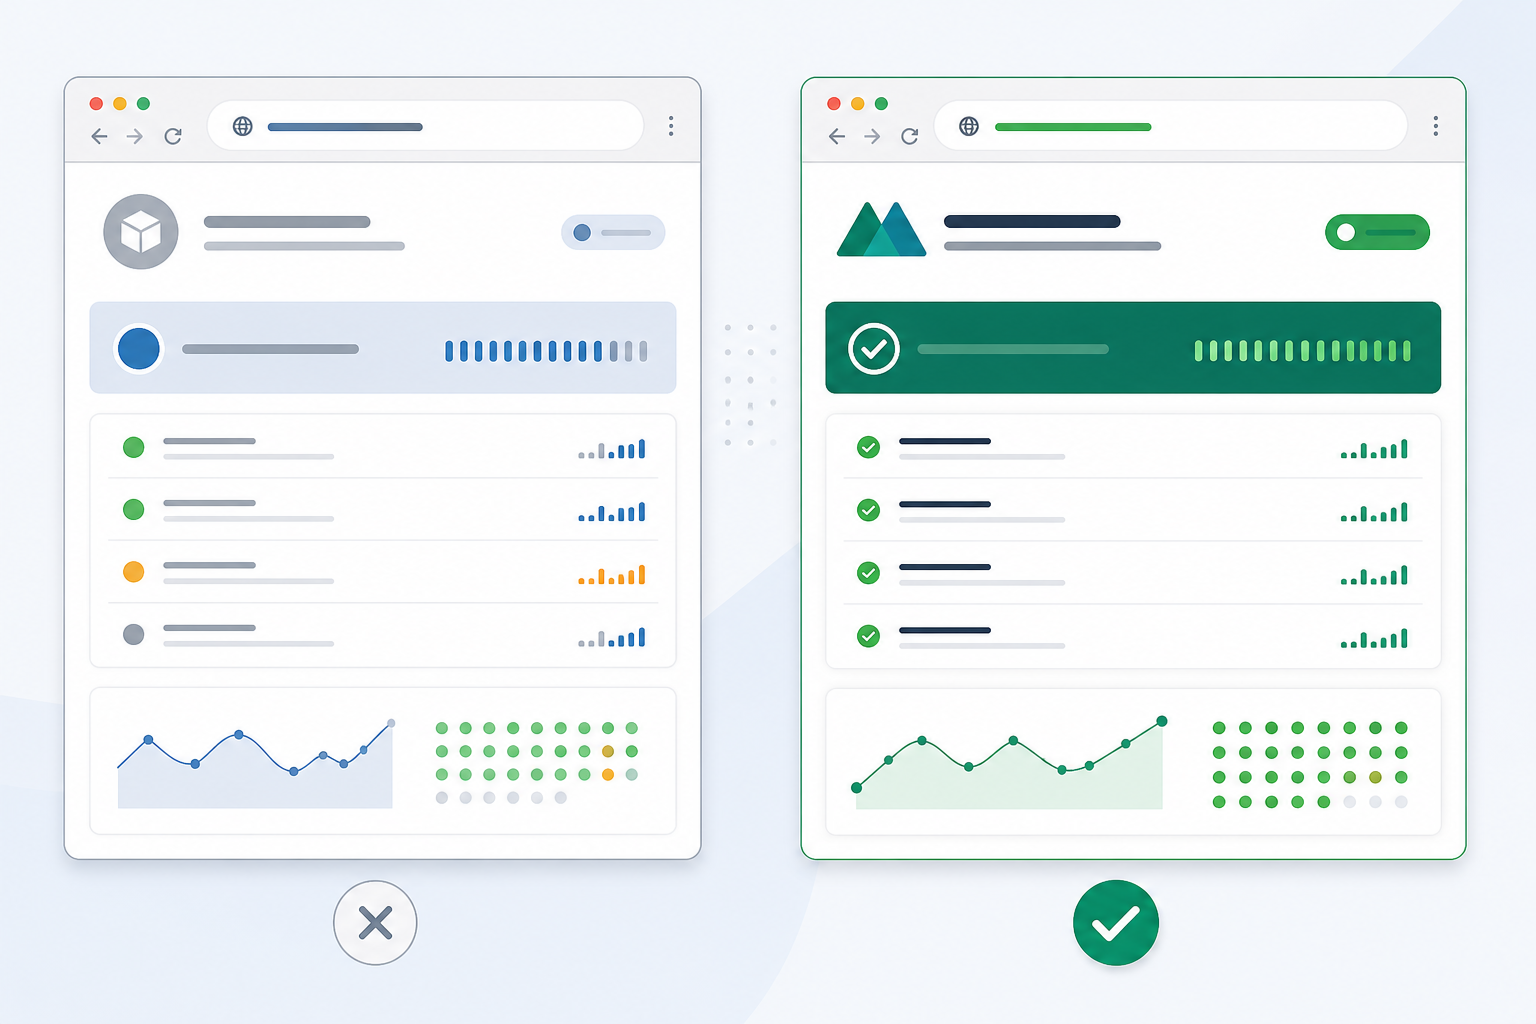
A branded status page for agencies gives clients a live, always-accessible view of uptime, response times and incident history, tied to their own brand rather than a monitoring vendor they've never heard of. It won't single-handedly stop a client from leaving (pricing, results and the relationship still do most of that work), but it does remove one common objection: the sense that they have no idea what they're actually paying for. That's a meaningful difference, even if it's not the whole story.
There's a quieter benefit too. When something does go wrong, a status page positions your agency as proactive rather than reactive. Instead of the client discovering an outage through their own users, they see it logged, acknowledged and resolved, often before they've noticed anything at all. That's the kind of detail that tends to come up naturally in a renewal conversation.
How to create a branded status page for each client
A generic monitoring badge that says "Powered by [Some Tool You've Never Heard Of]" undercuts the whole point. It reminds the client this is an outsourced afterthought rather than part of your service. A properly white-label status page removes that friction.
Here's what to look for when branding status pages for individual clients:
- Custom domain or subdomain mapping: something like status.clientdomain.com, so the page feels native to the client's own site rather than a bolt-on tool
- Client-specific logo, colour scheme and messaging: a tailored page per account rather than one shared template
- No visible third-party branding: so the client's own customers see this as part of their infrastructure, not evidence monitoring was outsourced
- Consistent tone and language: matching how the client already talks to their audience, whether formal or casual
One thing worth deciding upfront is whether the page should be public or private. A public status page is fine for straightforward uptime status, like "website is up" or "API is operational." It's usually not the right place for internal architecture details, hostnames, server names or anything that hints at security posture.
If a client wants deeper detail, say, response-time breakdowns by service or incident notes that reference internal systems, that's often better suited to a private, client-only reporting page or a shared dashboard rather than something open to the public internet. Ask the client which services they're comfortable naming publicly before you build the page, not after.
When a client's own customers land on that public status page during an outage, a fully branded, appropriately scoped experience builds credibility with them too. It signals the client runs a tight operation, which reflects well on everyone, including you.
How white-label status pages support client retention
Uptime monitoring often gets treated as invisible background maintenance, something clients assume is happening but rarely see evidence of. A white-label status page turns it into something visible. That's useful, but it's worth being precise about what it actually does: it supports a retention conversation by giving you real data to reference. It doesn't replace the conversation, and it's not a substitute for good service if something else is going wrong in the relationship.
Here's how that plays out in a quarterly business review. Instead of saying "everything's been running smoothly," you could pull up something like this:
- Uptime: 99.97% (target: 99.9%)
- Median response time: 240ms; p95 response time: 810ms
- Incidents logged: 2, both resolved within 30 minutes
- Mean time to acknowledge: 4 minutes
- Action taken: migrated to a faster server region after response-time trends flagged a slowdown
When you cite response times, be specific about what you're measuring: average, median or a percentile such as p95. A single average can hide the slow outliers that actually affect user experience. If you can show median response time held steady while p95 improved by 15% after a server migration, that's a concrete, defensible data point, not just a nice-sounding stat.
There's also a genuine upsell angle here, without overselling it. Clients without in-house DevOps staff often don't realise how much value there is in continuous server, API or SSL certificate monitoring until it's framed as its own service rather than something invisibly bundled into a retainer. A worked example: packaging "monitoring as a service" as a £40–£75/month add-on, covering uptime checks, SSL expiry alerts and a branded status page with a monthly summary, is a reasonable starting point for many small-business clients. Adjust based on your own costs and the number of services monitored.
How to share incident history transparently
This is the part that makes some agency owners nervous, and that's fair. The instinct is to quietly fix things and hope nobody notices. But clients usually find out anyway, through their own users, a support ticket or simply noticing something was off. Finding out you knew and didn't say anything is a bigger trust problem than the outage itself.
A documented incident history does the opposite, provided it's handled carefully. A few practical guidelines:
- Post an initial impact summary before you know the root cause. Something like: "We're investigating reports of slow page loads. Update to follow within 30 minutes." Don't guess at causes publicly until they're confirmed. A wrong early explanation is worse than a brief "we're looking into it."
- Follow up with a confirmed root-cause note once you know what happened. Use plain language and avoid unnecessary jargon: "A database connection issue caused slower page loads between 14:02 and 14:19. We've added extra capacity to prevent a recurrence."
- Log resolution times consistently. A pattern of fast detection and fast fixes speaks louder than any sales pitch.
- Avoid false alarms. This is where multi-region checking matters: if a monitoring tool flags a failure from one location, it's worth confirming the issue from a second location before logging it publicly, since a single check can reflect a local network blip rather than a real outage.
- Never expose sensitive details. Avoid naming internal servers, security vulnerabilities or customer data in a public incident note. Keep those details in an internal log or a private client report instead.
- Keep the tone matter-of-fact. Incidents happen to every website and every agency; how you communicate them is the differentiator.
How to set up white-label status pages for multiple clients
If you're managing several client sites, setting up individual status pages can sound like a lot of admin. With the right platform, monitor configuration itself is usually quick. The full onboarding process, including DNS changes, branding and client approval, takes longer than the monitor setup alone. It's worth separating the two when you're estimating time.
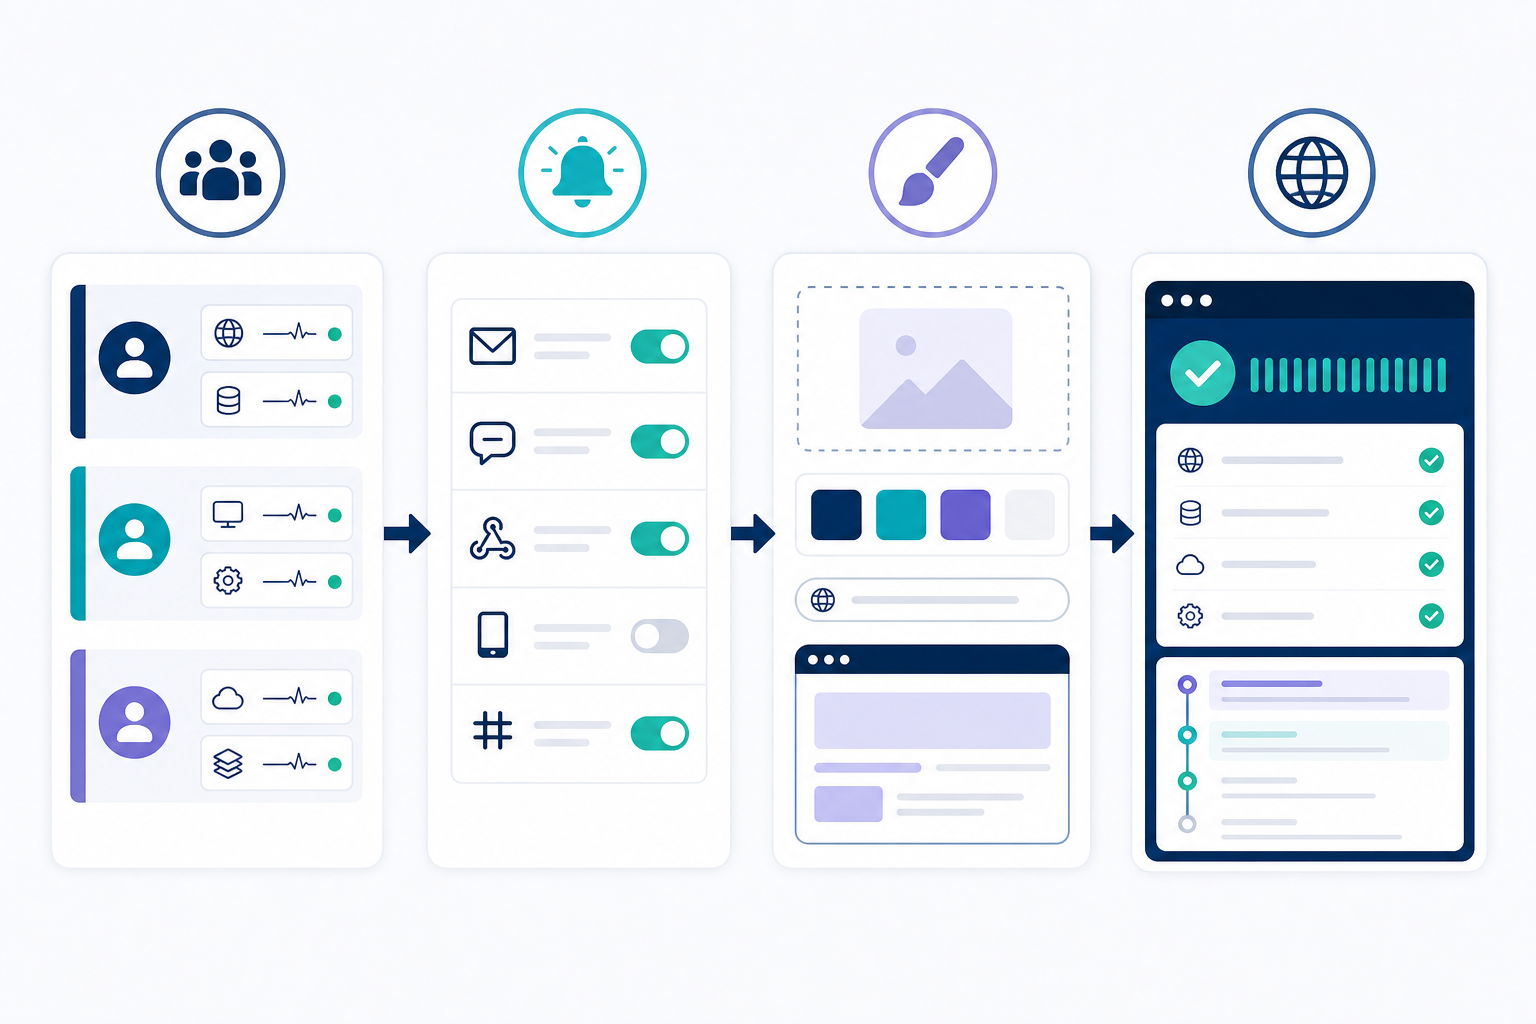
- Group monitors by client account or tag. This keeps everything organised as your client list grows and prevents one client's monitors from mixing into another's dashboard.
- Set up monitoring for each client's critical services. Typically this includes HTTP/S monitoring for the main site, API monitoring for integrations, SSL certificate monitoring to catch expiring certificates, and cron or heartbeat monitoring for scheduled tasks such as backups that fail silently if nobody's watching.
- Create a dedicated status page per client. Apply their logo, colour palette and custom domain. This step involves a DNS record change on the client's side, so factor in their turnaround time, not just yours.
- Configure incident alerting for your team first. Route alerts via Slack, email, Discord, Telegram or webhook so your team can investigate before the client sees a change on the status page.
- Get client sign-off before going live. Confirm which services will appear publicly, who receives notifications and whether any details need to stay off the public page.
- Repeat for the next client, using the same checklist so nothing gets missed as your roster grows.
A short onboarding checklist worth keeping handy: DNS record confirmed, SSL certificate issued for the custom domain, service names agreed with the client, notification recipients set and public-page content approved before launch.
What to look for in a white-label status page tool
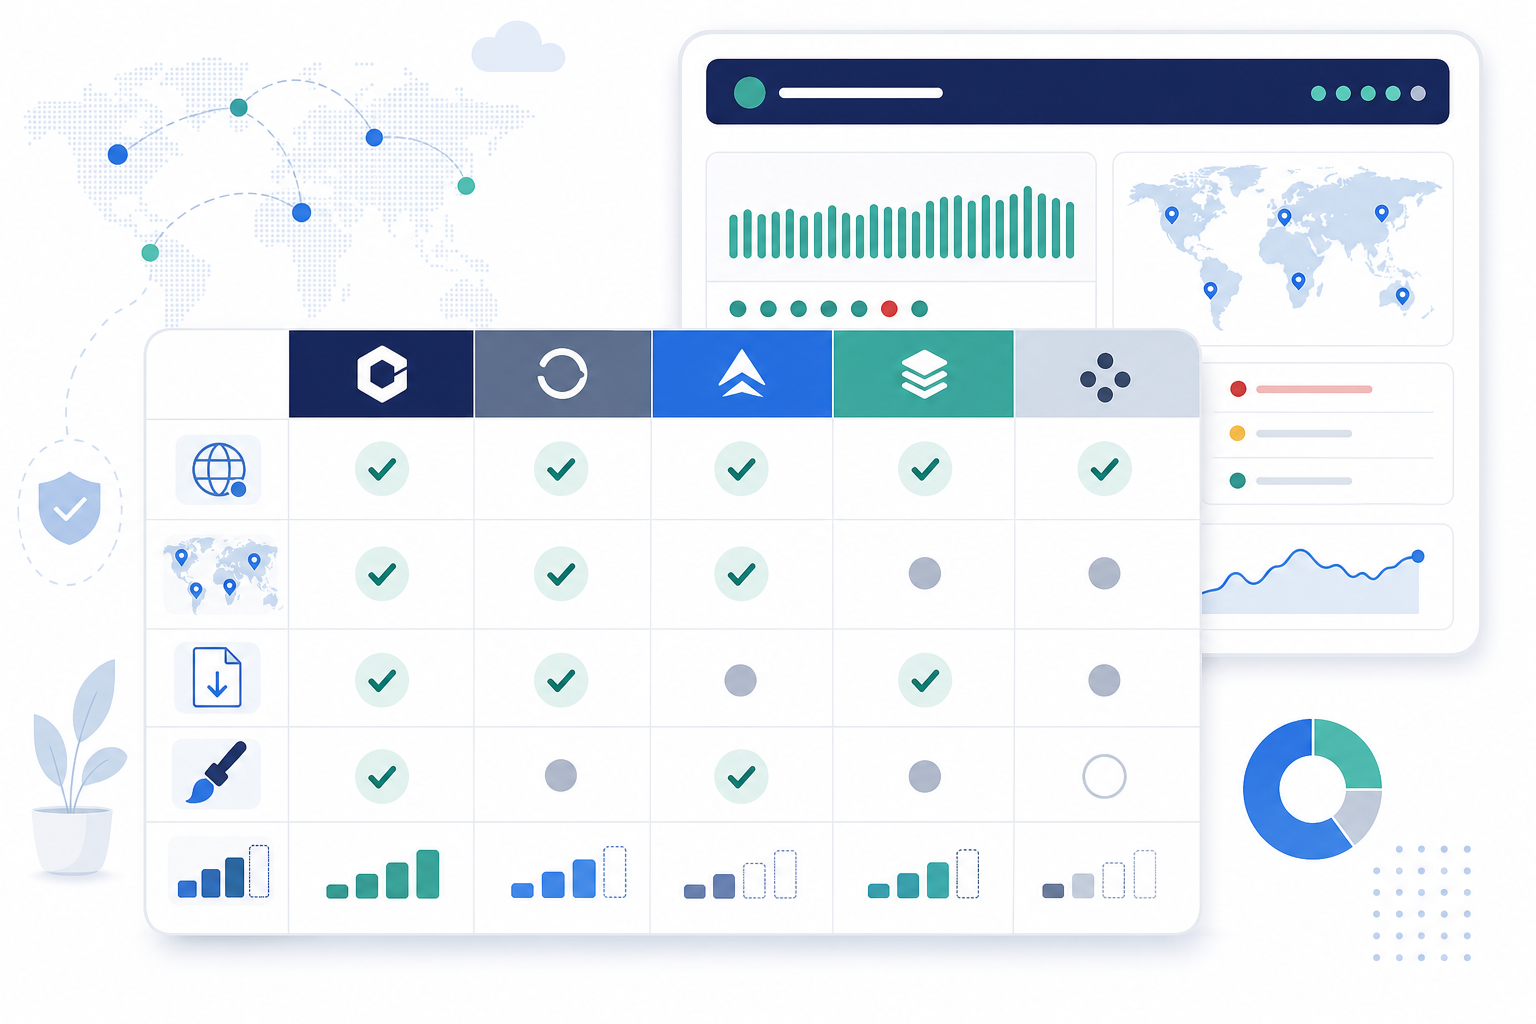
Not every monitoring tool is built with agencies in mind, and the gaps show up once you're managing more than a couple of clients. These are useful evaluation criteria to bring to any vendor conversation. Think of this as a checklist rather than a comparison of specific products:
| Evaluation criteria | Why it matters for agencies |
|---|---|
| Custom domain support | A forced subdomain undercuts the point of white-labelling |
| Multi-region failure verification | Reduces false-positive alerts reaching clients, though no verification method is completely foolproof |
| Data export and API access | Keeps your client reporting agency-owned rather than locked into one vendor's dashboard |
| Pricing that scales with monitors, not per-client fees | Growth shouldn't mean punishing pricing jumps with every new client |
| Multiple monitor types in one dashboard | HTTP/S, API, SSL, cron, DNS and port monitoring together saves juggling several tools |
| Public and private page options | Lets you scope what's visible externally versus what stays in client-only reporting |
| Client permissions and audit logs | Useful once you have team members managing multiple client accounts |
| Branded alerting and status pages | Keeps the client experience consistent from monitoring to incident communication |
If you're evaluating Moonitor specifically, it's worth checking these points directly against current plan documentation, since features and limits can change. At the time of writing, Moonitor offers eight monitor types, including HTTP/S, keyword, port and ping, SSL and domain expiration, cron/heartbeat and DNS record change detection, aimed at letting agencies consolidate client monitoring into one dashboard. It includes multi-region checks intended to reduce false-positive alerts (though, as with any monitoring tool, no system catches every edge case), plus API access and data export so your reporting isn't locked into the platform.
At the time of writing, Moonitor's Solo plan starts at £14/month for around 20 monitors, scaling up to a Max plan at £49/month for unlimited monitors. Confirm current pricing and whether it's quoted inclusive or exclusive of VAT before budgeting, since this can change and matters for UK invoicing. A 7-day free trial with no credit card required is a low-risk way to test branded status pages and custom-domain setup before committing a client's monitoring to any platform. Whichever tool you choose, ask vendors directly about public and private page options, DNS setup support and data portability. These tend to matter more day to day than the marketing page suggests.
White-label status page FAQ
Can agencies create a branded status page for each client?
Yes. Most agency-focused monitoring platforms let you set up a separate public status page per client, with its own logo, colours and custom domain, so it reads as an extension of the client's brand rather than a third-party tool. Confirm with your chosen vendor whether custom domains are included on your plan tier.
How do white-label status pages help with client retention?
They give clients an always-visible record of uptime and reliability, which supports renewal conversations with real data instead of vague reassurance. They're not a standalone fix for churn (service quality and communication still matter most), but they remove a common source of client doubt: not knowing what they're paying for.
Should a client's status page be public or private?
It depends on what you're showing. Basic uptime status is usually fine to make public. Detailed response-time breakdowns, internal incident notes or anything referencing infrastructure specifics are often better suited to a private, client-only report. Agree with each client which services and details they're comfortable making public before the page goes live.
How do I set up separate status pages for multiple clients?
Group your monitors by client, then create an individual status page for each one with its own branding and domain. Monitor setup itself can be quick on the right platform, but budget extra time for DNS changes and client sign-off, since those depend on the client's own turnaround.
Do clients need technical knowledge to understand a status page?
No. A well-designed page shows simple uptime percentages, current status and plain-language incident summaries, so non-technical clients can follow along without needing to understand the underlying monitoring setup.
Can I show incident history without alarming clients?
Yes, with care. Post an initial impact summary before the root cause is confirmed, follow up with a plain-language explanation once you know what happened, and avoid naming sensitive infrastructure details publicly. Pairing incident logs with resolution times builds confidence rather than concern, but only if the information shared is accurate and appropriately scoped.