
Agency Uptime Monitoring: How to Centralise Monitoring Across Dozens of Client Sites
Agency uptime monitoring for UK client sites: organise alerts, track performance and report uptime professionally from one centralised dashboard.
Agency Uptime Monitoring: How to Manage Dozens of Client Sites From One Dashboard
If you're running a digital agency and you've got more than a handful of client sites live, you already know the feeling. It's 6pm on a Friday, you're about to close the laptop, and someone pings you: "Hey, is clientname.co.uk down for you too?" You didn't know. You had no idea. Now you're frantically checking three different tools while trying to remember which login goes with which client.
This is a guide for agencies and managed service providers who've outgrown that scramble — or can feel themselves heading there. We'll walk through how to build a reliable system for agency uptime monitoring: organising monitors by client, routing alerts to the right person, reporting uptime professionally, and scaling your setup as you add clients.
The short version: stop juggling spreadsheets, client logins, and separate monitoring tools. A centralised monitoring dashboard lets you organise every client site under one account, tag monitors by project, route alerts to the right team member, and give clients a branded status page instead of sending a panicked email. I'll use Moonitor as a working example throughout, partly because its tagging system and unlimited monitor plans make this genuinely workable even past 50+ sites, but the underlying method matters more than any single tool.
The Real Challenge of Monitoring Many Client Sites
Why fragmented client site monitoring becomes a problem
Here's how monitoring sprawl usually happens, in my experience watching this play out at agency after agency. You start small: one client, one uptime checker, maybe a free tool you signed up for on a Tuesday afternoon. Client two comes along, and you add another monitor — perhaps on the same tool, perhaps on a different one because someone on the team had a preference. Fast forward eighteen months and you've got uptime checks in one platform, SSL expiry reminders in another, and a spreadsheet somewhere, probably out of date, trying to track who owns what.
I don't think this is unusual. It's simply how most agencies end up managing client site monitoring, because nobody sits down on day one and designs a system. You react to whatever the immediate need is, and the tooling grows sideways instead of on purpose.
The cost of that chaos isn't just annoying — it's expensive in ways that matter. When a client's site goes down and you find out from them instead of the other way round, that's not a small dent. It's the kind of moment that makes a client start quietly shopping around for a new agency, even if they never say it out loud. Retainers get reviewed. Trust erodes. And "why didn't you tell me" is one of those questions that's hard to fully recover from once it's been asked.
There's also a quieter problem: alert fatigue. When monitoring is set up inconsistently across clients, with different thresholds and no verification logic, you get false alarms. A blip that resolves itself in ten seconds triggers a Slack notification that wakes someone up. After a few false alarms in a week, people stop trusting the alerts altogether. That's arguably more dangerous than having no monitoring at all, because now the real incidents get lost in the noise too.
In my experience, somewhere around 10 to 15 active client sites is where fragmented monitoring stops being a minor annoyance and starts costing real time — though this varies depending on team size and how manual your process already is. Past that point, centralising isn't a nice-to-have. It's what lets you scale without someone having to remember which of four tools has the answer.
How to Centralise Client Site Monitoring by Client and Project
Once you've decided to centralise, the temptation is to dump every URL you can find into one dashboard and call it done. Resist that urge. A little structure upfront saves hours of confusion later, especially as your team grows and new people need to understand the setup without a two-hour handover call.
Here's a practical sequence that works for agencies of pretty much any size:
Set a naming and tagging convention before adding a single monitor. Something like
ClientName – Project – Environment – Severitykeeps things scannable. For example:Acme Ltd – Main Site – Production – P1. Decide this now, not after you've already added 40 monitors with inconsistent names.Group monitors logically per client. For each client, you'll typically want website checks, API endpoints, cron jobs, SSL certificates, and DNS records represented. Think of it as "what does this client's entire digital footprint look like" rather than "what's the one thing I need to check."
Use dashboard filtering to view everything for one client at once. This is where a centralised monitoring dashboard earns its keep. In Moonitor, tagging monitors by client lets you filter your view instantly — no digging through unrelated alerts, no cross-referencing a spreadsheet.
Decide early how you'll handle staging environments. Some agencies monitor staging with the same rigour as production, useful if clients demo from staging regularly. Others keep staging separate or skip it to avoid noise. Either is fine — just pick one and stick with it.
Write the structure down somewhere the whole team can see it. A shared document or wiki page works fine. The worst version of this system is one that only lives in the head of whoever set it up first, because that person eventually goes on holiday, or leaves, and everyone else is left guessing.
A quick worked example: say you're onboarding "Acme Ltd." Your monitor inventory might look like this: Acme Ltd – Website – Production (HTTP check, P1), Acme Ltd – Checkout API – Production (P1), Acme Ltd – SSL Certificate (P2), Acme Ltd – DNS Records (P2), Acme Ltd – Nightly Backup Cron (P2), and Acme Ltd – Staging Site (P3, lower urgency). That's six monitors for one client before you've even added a second site — which is exactly why the multiplication problem in the scaling section below happens faster than people expect.
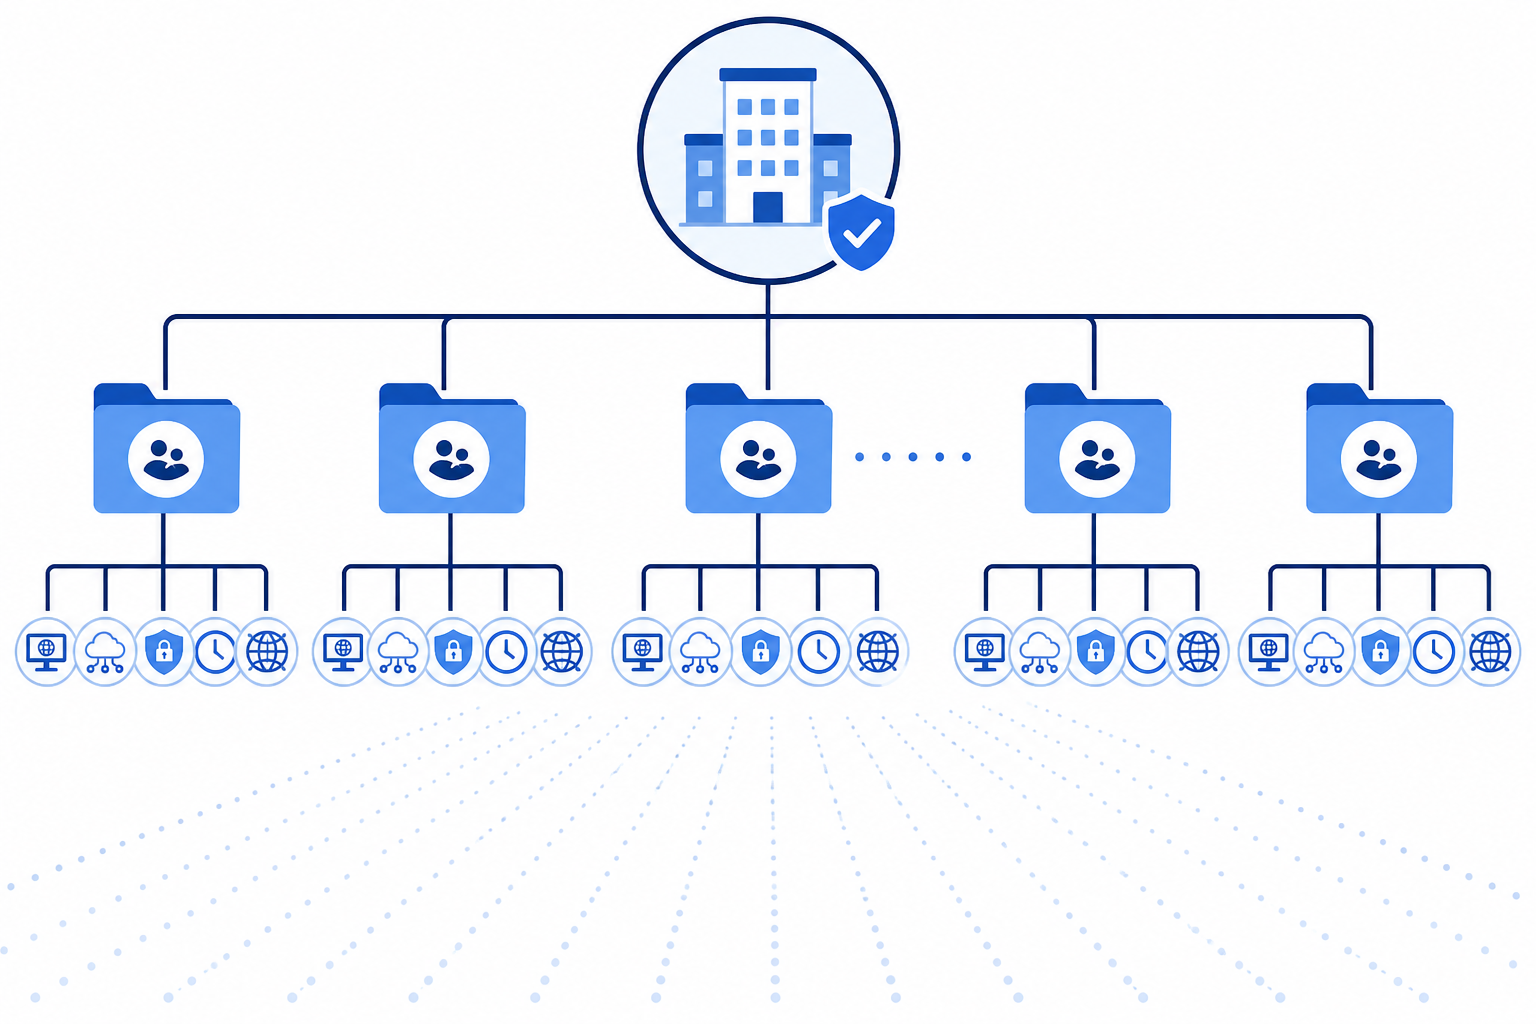
Getting this right from the start means that when client number 30 signs on, adding their monitoring setup takes minutes rather than becoming its own mini-project.
Delegating Alert Ownership Within Your Team
Here's a mistake I see constantly: agencies set up monitoring, then configure every alert to go to every team member, thinking that's the "safe" option. It usually isn't. When everyone gets every alert, nobody feels personally responsible for responding, and notifications become background noise people learn to scroll past.
A practical alert-routing matrix for agencies
The fix is deliberate ownership, ideally tied to severity levels rather than a flat "send everything everywhere" rule. Here's a simple example of what that routing matrix might look like:
| Severity | What it means | Who's alerted | Channel | Target response |
|---|---|---|---|---|
| P1 | Site or checkout down | Assigned developer + team lead | Slack + phone/SMS | Under 5 minutes |
| P2 | SSL, DNS, or cron failure | Assigned developer | Slack | Under 30 minutes |
| P3 | Staging or non-critical | Weekly digest | Next business day |
A few principles that hold true regardless of which tool you use:
- Assign specific team members or channels to specific clients. Route Client A's incidents to the developer who built their site, and Client B's to a dedicated support channel, rather than everything landing in one giant channel that gets muted within a week. Moonitor supports alert routing via Slack, Discord, Telegram, email, and webhooks, which makes this kind of split straightforward to set up.
- Build in escalation where your tooling allows it. If the first responder doesn't acknowledge an alert within a set time, it should escalate rather than quietly disappear into a muted channel at 2am. Not every monitoring platform handles acknowledgement and escalation the same way, so it's worth checking your tool's current documentation for exactly how this works before you rely on it for a P1 client.
- Use incident history to spot patterns. Most platforms, including Moonitor, keep a record of alerts and response times. Reviewing that periodically is useful for spotting whether one person is consistently overloaded, or whether a particular client's alerts keep slipping through.
- Protect your founder or lead developer from the "gets every alert" trap. I've spoken with agency owners who were still the sole recipient of every uptime alert for 40+ clients, years after hiring a team specifically to take that load off. It's an easy trap to fall into because it feels like control, but it's a fast route to burnout. Delegated alert ownership isn't just operationally smarter — it protects the people running the business.
Getting alert ownership right is one of those unglamorous fixes that pays off constantly. It's the difference between a team that responds calmly to incidents and one that's perpetually exhausted by false urgency.
Reporting Uptime to Clients Professionally
Clients don't want to hear "trust me, it's fine," especially ones who've been burned by a previous agency that went quiet during an outage, or worse, denied there was ever a problem. Clients now have easy access to their own analytics and search rankings, so vague reassurance doesn't land the way it might have a few years ago.
Use a branded public status page
The better approach is giving clients somewhere to look for themselves. A branded public status page does exactly this: instead of emailing you every time they're slightly worried, they can check a page showing current status, uptime history, and any active incidents, with your agency's branding on it, reinforcing that this is part of the professional service you provide.
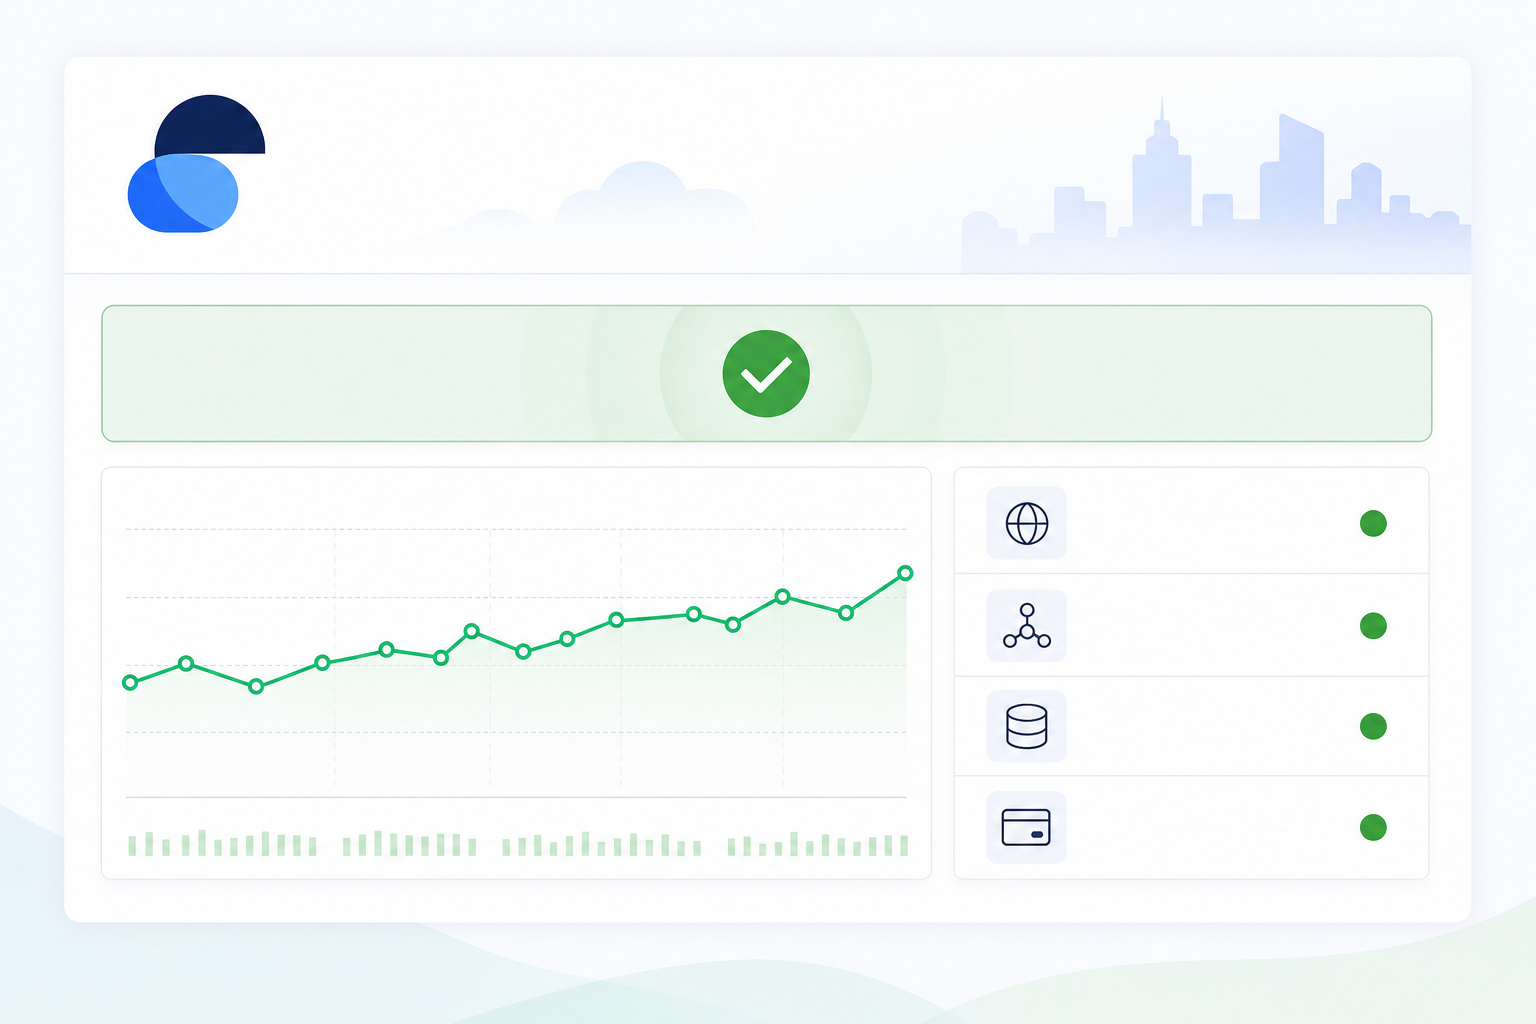
Beyond the status page, response-time data and incident history give you the raw material for genuinely useful monthly reporting. A simple monthly report structure that works well:
- Overall uptime percentage for the month, compared to the previous month
- Average response time across key endpoints
- Incidents logged, with cause, duration, and resolution
- Any planned maintenance windows, and what was affected
- Exclusions, such as third-party outages outside your control
Rather than a generic "everything's been fine this month" email, you can show actual numbers and a clear record of any incidents along with how quickly your team resolved them. This does two things: it demonstrates real value for the retainer fee, and it builds a paper trail that protects you if a client ever questions your reliability.
Here's the counterintuitive bit: being upfront about brief incidents tends to build more client trust than pretending nothing ever happens. A short note like "We noticed a 3-minute outage on the 14th, here's what caused it and what we did" reads as competent and transparent. Silence, on the other hand, reads as either incompetence or dishonesty once a client finds out on their own — and they usually do.
Monitor the Full Stack: Types of Client Site Monitoring Agencies Need
A lot of agency uptime monitoring setups only cover the obvious thing: the homepage loading. That's a reasonable start, but it leaves blind spots that tend to surface at the worst possible moments. Here's the fuller picture, split into baseline and deeper coverage:
Baseline coverage:
- Website and HTTP/S monitoring — catches the outages clients notice within minutes because their site simply won't load.
- SSL certificate monitoring — so nobody's greeted with a "not secure" browser warning three days before a certificate quietly expires. Entirely preventable, and yet it happens constantly.
Deeper application and infrastructure coverage:
- API monitoring — for the backend services powering checkout flows, third-party integrations, or mobile apps that clients rely on but never see directly. When these fail silently, clients often don't realise until sales drop.
- DNS monitoring — to catch unauthorised or accidental DNS record changes before a client's email stops working or their site starts resolving to the wrong server.
- Cron and heartbeat monitoring — for scheduled jobs like nightly backups, data syncs, or automated reports. These fail silently more often than you'd think, and nobody notices until a client asks where last month's backup went.
- Port and ping checks — for the underlying servers and infrastructure that clients assume "just work" without ever thinking about them.
That's six monitor types in total. Moonitor covers all six from a single dashboard, which matters for agencies specifically, since it means you're not stitching together separate subscriptions just to get full coverage for one client's stack. As with any platform, it's worth checking current product documentation before you commit, since coverage and features do evolve.
Scaling Your Monitoring Plan as You Add Clients
Estimate monitor requirements before onboarding
Here's something that catches agencies off guard: monitor counts multiply fast. It feels like it shouldn't — one client, one site, right? But once you're properly covering website, API, SSL, DNS, and cron checks per client (five to six monitors, based on the Acme example earlier), a single client account can easily need 5 to 8 monitors on its own. Multiply that across 15 or 20 clients and you're well past 100 monitors before you've noticed. A rough formula: (clients × monitors per client) + staging environments + shared infrastructure checks.
This is where plan structure matters. A capped plan that felt generous at 5 clients can suddenly feel restrictive at 15, often right in the middle of onboarding a new account — a genuinely bad time to discover you need to upgrade.
| Solo Plan | Max Plan | |
|---|---|---|
| Price (approx., excl. VAT) | ~£11/mo | ~£39/mo |
| Monitor limit | 20 monitors | Unlimited |
| Alert channels | Email, Slack | Email, Slack, Discord, Telegram, webhooks |
| Status pages | Basic | Branded, custom domain |
| Team members | 1–2 | Multiple, role-based |
| Best for | Freelancers, very small agencies | Growing agencies with multiple clients |
Pricing shown is an approximate GBP conversion at time of writing and excludes VAT. Always check current pricing directly with the provider before committing, as plans and exchange rates change.
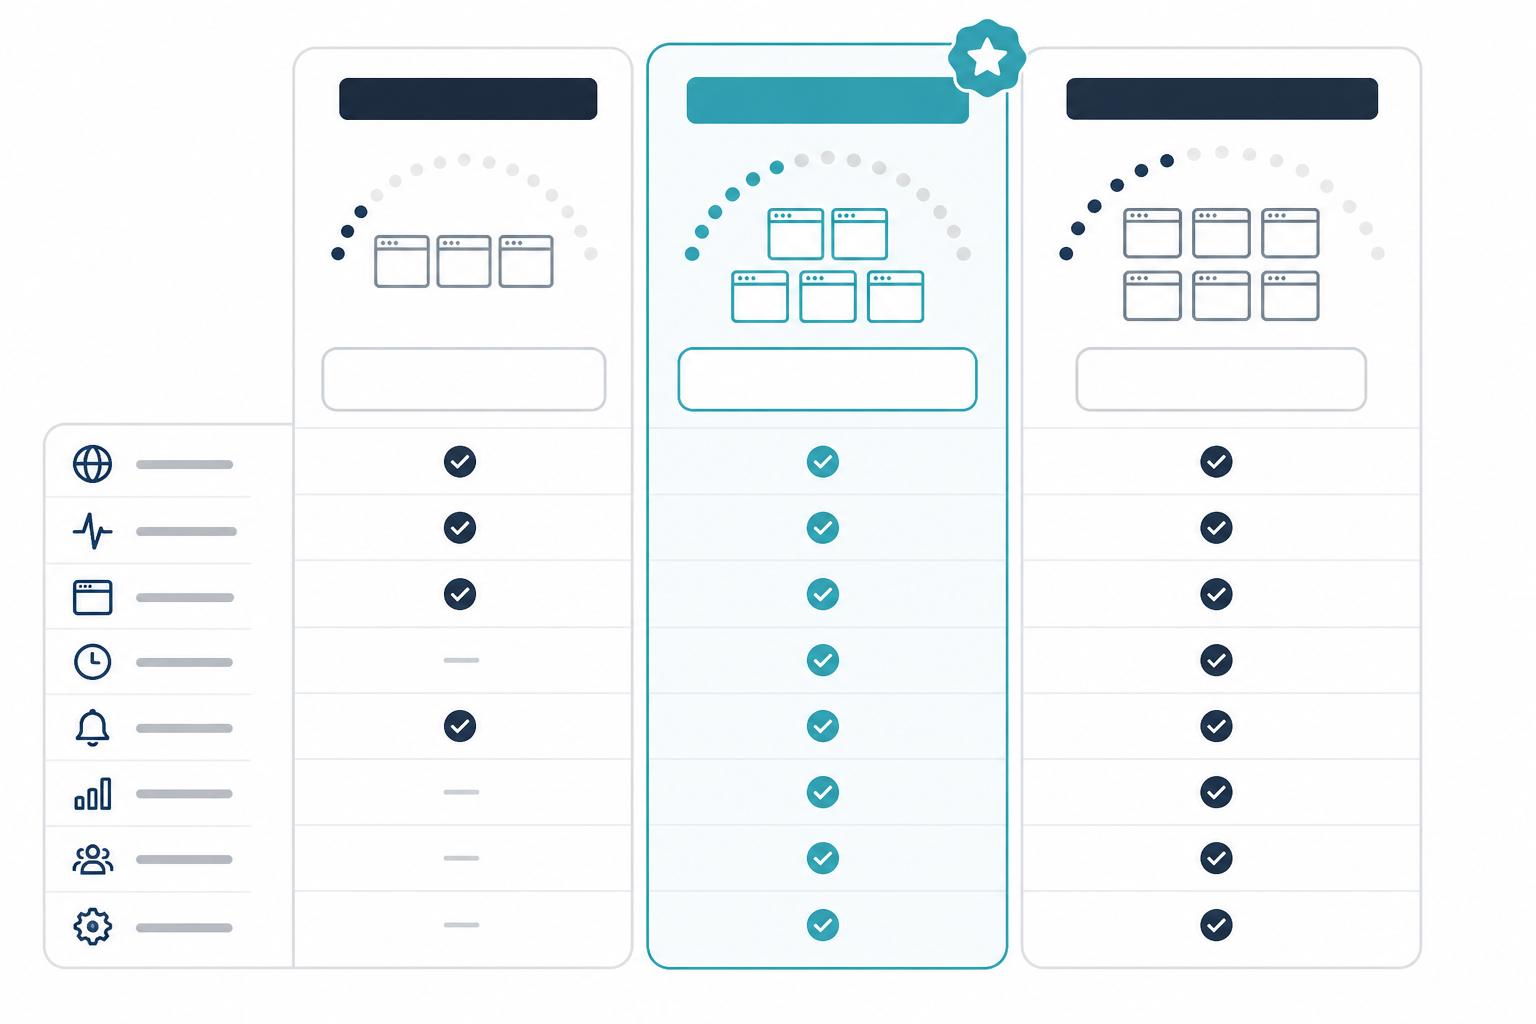
My honest suggestion: use a free trial period to actually map out your real monitor count before committing to anything. Add every client, every environment, every monitor type you'd realistically want, and see where the number lands. If you're anywhere close to 20 monitors with only a handful of clients, an unlimited plan will save you a mid-onboarding scramble later.
One more thing worth planning for early: API access and data export. Agencies grow, and tools that felt right at 10 clients don't always fit at 100. If a platform offers API access and straightforward data export, confirm it directly in their documentation rather than assuming — it's what keeps you from feeling locked in if your needs change down the line, without losing years of incident history in the process.
Putting It Together: An Agency Uptime Monitoring Checklist
Before you touch a single tool, it helps to have a short, concrete plan. Here's a four-step starting point:
- Inventory every client site, API, cron job, and certificate you're currently responsible for, even loosely.
- Define your taxonomy — naming convention, tags, and severity levels — before adding a single monitor.
- Assign ownership for each client or severity tier, and set up escalation where your tool supports it.
- Test your reporting with one client first: set up their status page and run a mock monthly report before rolling it out agency-wide.
Frequently Asked Questions About Agency Uptime Monitoring
How do agencies monitor uptime for many clients at once?
Most agencies that get this right use one centralised platform rather than stitching together separate tools per client. The key is a consistent tagging and naming structure from day one, then a dashboard that lets you filter by client instantly. Moonitor, for example, lets you view every monitor for a single client without wading through unrelated alerts from other accounts.
How do I organise monitors by client account?
Start with a naming convention that includes the client name, project or site, and environment (production versus staging). Group related monitors together — website, API, SSL, DNS, and cron jobs — so you can see a client's entire footprint in one view. Write the convention down and get your whole team using it consistently, otherwise it falls apart the moment someone new joins.
How do I report uptime performance to clients?
Branded public status pages are the cleanest solution, since clients can check uptime themselves instead of pinging you for reassurance. Pair that with monthly summaries pulled from incident history and response-time data, showing real numbers rather than vague reassurances. Being upfront about brief incidents, and how quickly your team responded, tends to build more trust than hiding them.
What should I do about false alarms and alert fatigue?
Inconsistent thresholds across clients are usually the culprit. Standardise your check intervals and verification settings across all client monitors, and route alerts by severity rather than sending everything to everyone. If your team starts ignoring alerts, that's a sign the thresholds or routing need adjusting, not a sign to add more monitoring.
What happens if I add more clients than my monitoring plan allows?
This is more common than agencies expect — monitor counts multiply fast once you're tracking website, API, SSL, and cron checks per client. It's worth mapping out your realistic monitor count during a free trial period so you can choose between a capped plan or an unlimited option before you hit a wall mid-onboarding.
If you're still running client monitoring across three different logins and a spreadsheet, it might be time for a change. Run through the checklist above with one client first, then consider a platform like Moonitor's 7-day free trial (no credit card required) to see what a properly centralised setup could look like for your agency.