
How Agencies Can Centralize Monitoring for Every Client (Without Losing Their Minds)
Discover how agencies centralise API monitoring, manage dozens of client sites, automate uptime reports, and launch a branded status page for clients.
API Monitoring for Agencies: How to Centralise Every Client Without Losing Your Mind
Meta description: See how agencies use API monitoring to manage client sites, catch hidden failures, deliver branded status pages, and automate uptime reports.
Here's the distinction that trips up most agencies: a URL uptime check tells you a server responded. It says nothing about whether the API actually did its job. A booking API can return a perfectly healthy HTTP 200 while the response body is empty because a backend timeout failed silently behind the scenes. If you're only checking “is the site up?”, you'll never catch that. And if you're juggling that blind spot across a dozen or fifty client accounts, in a dozen different tools, you're not managing infrastructure — you're managing scattered attention.
The fix is to bring everything onto one platform — website uptime, proper API health checks, SSL certificates, servers, and cron jobs — organised by client, with alerts that reach the right person without the noise. Add a branded status page and uptime report for each client, and your monitoring process becomes far easier to manage.
I use Moonitor for this, and I'll be upfront about that as we go, but the principles here hold regardless of which platform you choose. Centralising API monitoring properly means you stop finding out about a broken payment integration from an angry client email and start catching it before anyone notices.
This guide explains how agency teams can monitor dozens of client websites and APIs in one place, including what API monitoring needs to cover beyond basic website uptime.
The Problem with Fragmented Monitoring: A Day in the Life of an Agency
Picture your Monday morning. You open your laptop and check Site A's uptime tool — the free one you set up two years ago and never migrated away from. Then you tab over to Slack for Client B, where someone dropped a server alert at 3am that nobody saw until now. Next, you're digging through Client C's shared inbox looking for an SSL expiry notice buried under a dozen other emails, and the certificate lapsed yesterday.
Here's the one that stings most, though: Client D's booking API has been returning a healthy HTTP 200 all weekend, but the response body has been empty since Saturday because a backend timeout is silently failing. A basic “is the URL reachable?” check has no way of telling a working API from one that's technically online but functionally broken. You find out on Monday when the client forwards three customer complaints, one of them screenshotted and posted on social media, and you spend the first forty minutes of your week apologising before you've even opened your own inbox.
If this sounds familiar, you're not alone. Fragmented monitoring doesn't just mean fragmented tools — it means fragmented attention, and that's a fundamentally reactive position. Every extra tool is another login to remember, another place bugs can hide, and another chance for a client to email “is the site down?” before you've noticed yourself. That erodes trust quickly, particularly when the issue is an API quietly failing rather than an outage anyone would spot on sight.
This scattered setup doesn't scale either. You might hold three or four clients' worth of monitoring chaos in your head just fine. Somewhere around client five or six, something breaks — usually not the infrastructure, but your patience or an SSL certificate you swore you'd renew “next week”. The rest of this guide is about building an API monitoring operating model that holds up well past client six.
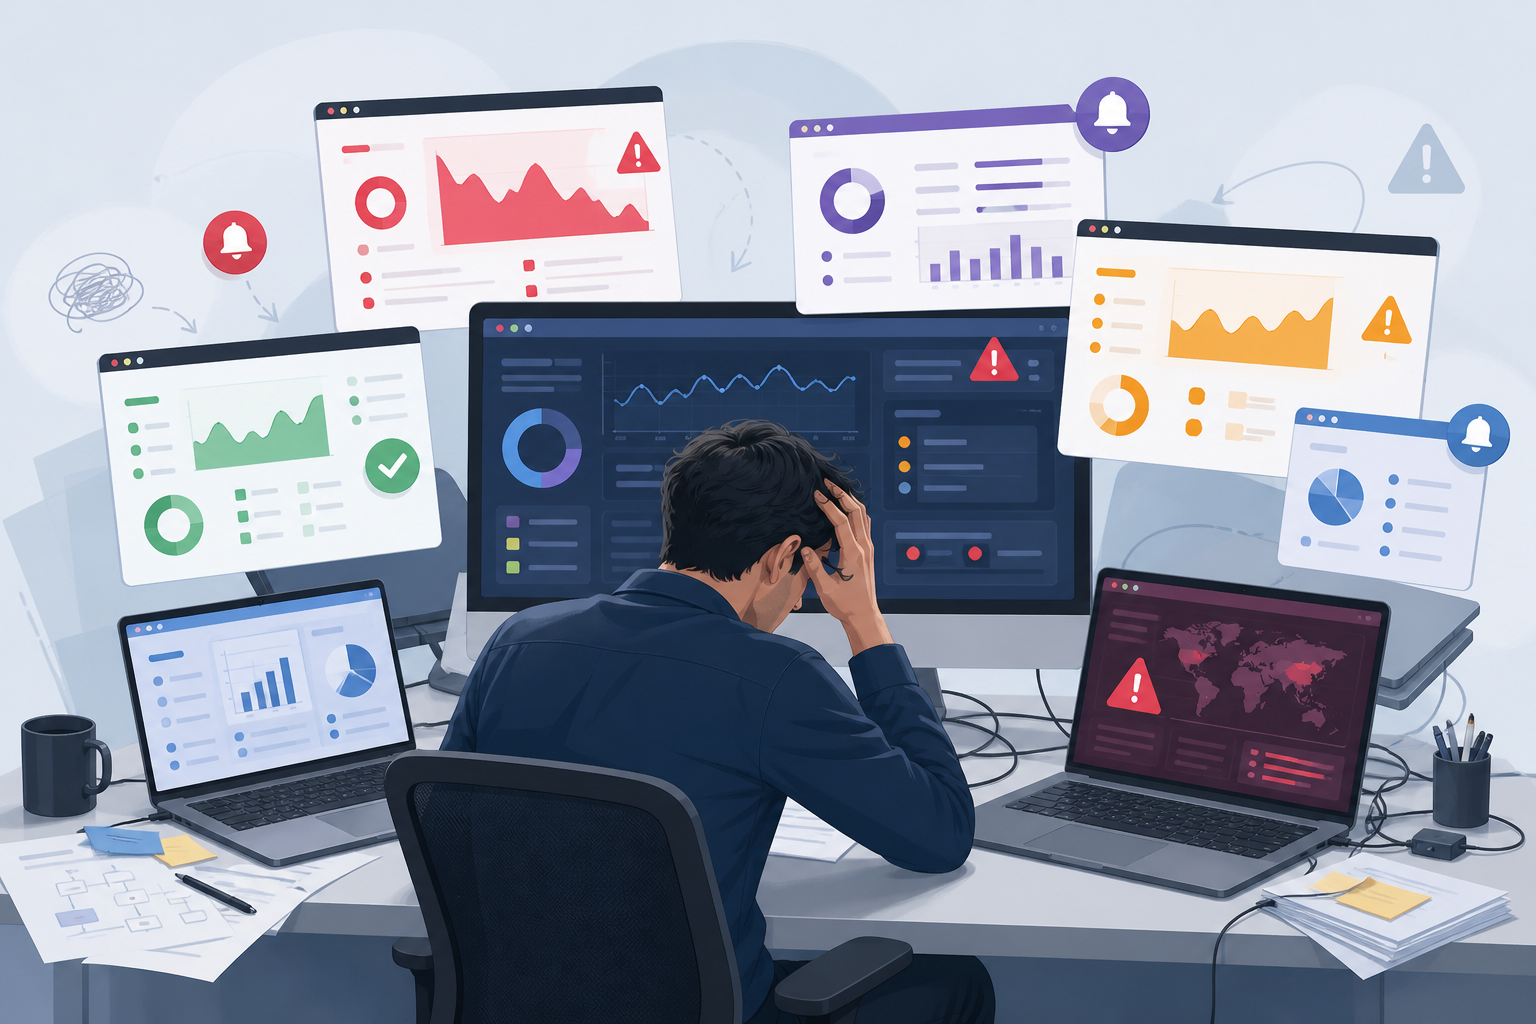 Suggested alt text: An overwhelmed agency team member surrounded by multiple browser tabs and monitoring dashboards, representing fragmented client monitoring.
How Can an Agency Monitor Dozens of Client Sites in One Place?
Fixing this isn't complicated, but it does require treating API monitoring as its own discipline rather than an afterthought bolted onto uptime checks. Here's the operating model I'd build if I were setting this up for an agency from scratch.
Choose a platform that covers every monitor type you need, then build a repeatable onboarding routine. For each new client, the sequence looks roughly like this: create a dedicated workspace or tag set for them, define their environments (production, staging, and sometimes a QA sandbox), import a standard monitor template rather than building checks from nothing, assign an internal owner who gets first-line alerts, configure escalation paths, publish the status page, and review everything after seven days to catch false positives before they pile up. Doing this consistently is what allows you to manage dozens of clients without the setup itself becoming a monitoring problem.
What Should a Proper API Health Check Include?
Build API checks properly — here's what that looks like for a real endpoint. Say you're monitoring a client's booking API payment confirmation endpoint. You'd define the HTTP method (POST, in this case), a dedicated test route or a sandboxed synthetic transaction rather than anything touching real customer data or triggering an actual charge, authentication handled via a scoped API key or test-mode Bearer token stored in your platform's secrets manager rather than hardcoded anywhere, a rotation schedule for that credential, the expected status code, a response-body assertion checking for a specific field or value (not just “any JSON came back”), a latency threshold appropriate to a payment flow, and a dependency check that flags when the failure originates from a third-party payment processor rather than the client's own infrastructure.
You'd also cap the check interval to respect the endpoint's rate limits and make sure the request is genuinely non-destructive — no live charges, no real bookings created, and no test data leaking into production reports. A marketing newsletter signup form doesn't need this level of rigour; a payment endpoint does. Match the depth of the check to what's actually at stake if it breaks.
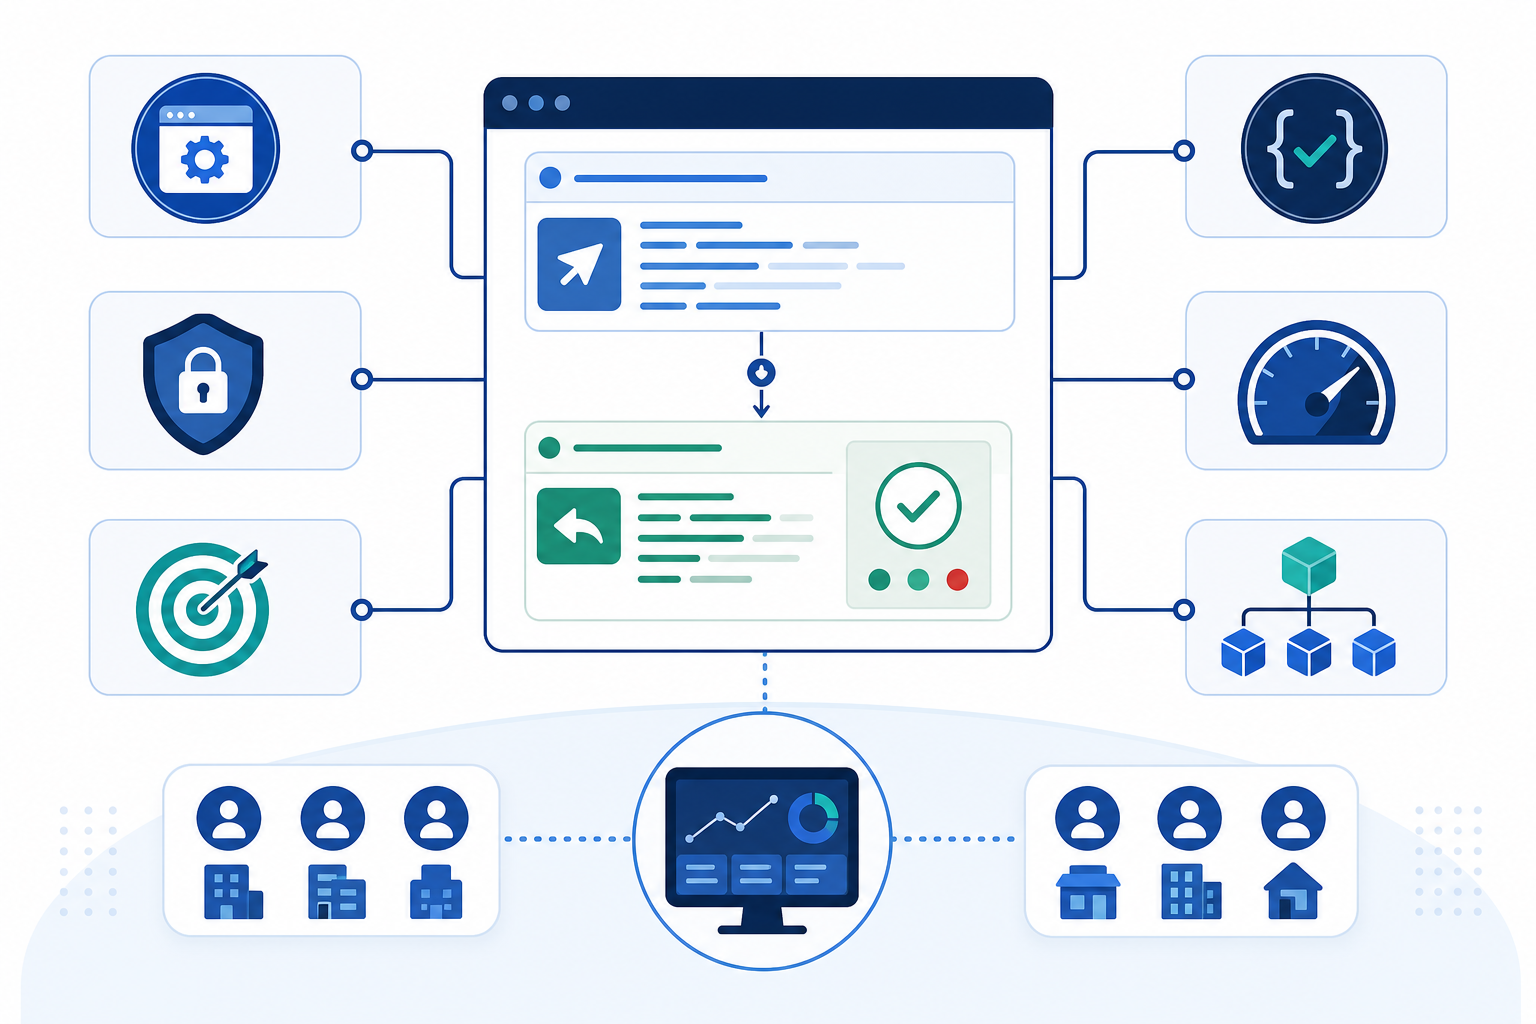 Suggested alt text: Diagram showing the components of a properly configured API health check, including authentication, response assertions, and dependency tracking.
Add monitors as you onboard clients, not all at once. The temptation is to import everything on day one, but doing it gradually gives you room to catch a badly tuned assertion before it desensitises your team to real alerts.
Use multi-region checks for anything customer-facing, but know what you're trading off. Requiring a check to fail from more than one location before treating it as a real incident meaningfully reduces false alarms caused by a single flaky network blip. It can add a small amount of detection delay while the second region confirms the failure. For a production payment API, that trade-off is almost always worthwhile. For a low-stakes internal tool, it might not be.
Set check intervals based on business risk, not contract tier alone. A high-traffic checkout API that hits rate limits if you poll too aggressively needs a different interval from a low-traffic reporting endpoint, regardless of what the client pays. Factor in the endpoint's rate limits, how costly a false alert is to investigate, and any SLA you've actually promised.
Keep API export access available. Being able to export your monitoring data — for a custom client report or a full migration — matters more than people realise until they're stuck. In Moonitor, this sits under the account API settings; whichever platform you use, confirm your plan includes it before you rely on it.
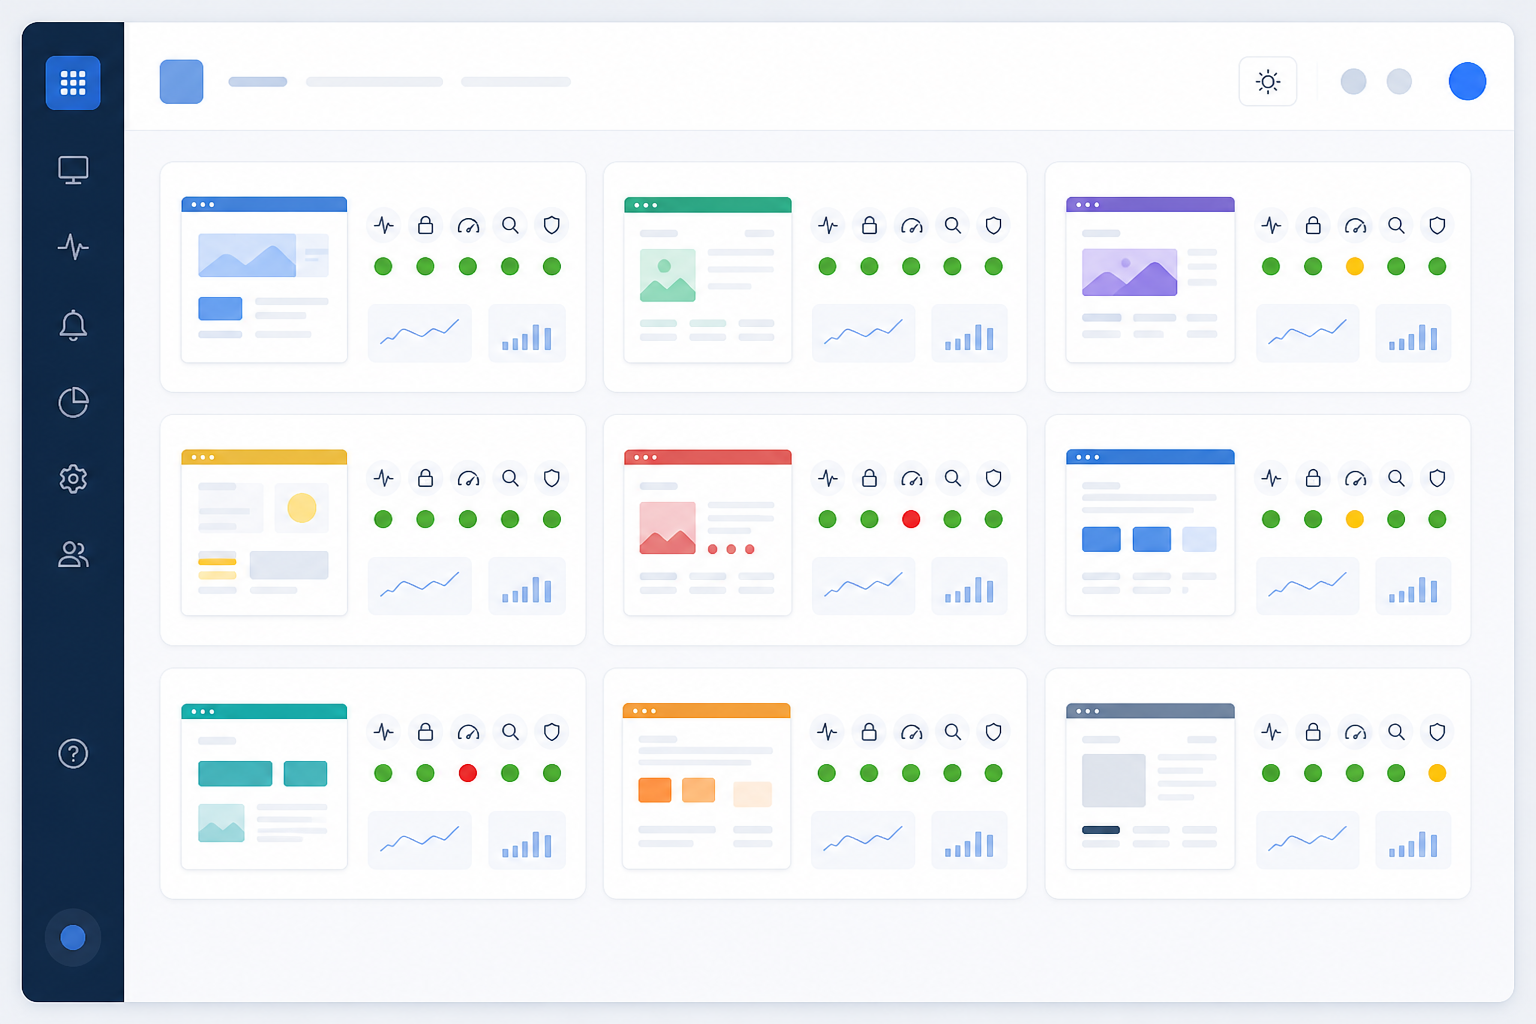 Suggested alt text: A centralised monitoring dashboard showing multiple client accounts with colour-coded status indicators for uptime, API, and SSL checks.
How to Set Up a Centralised API Monitoring Dashboard
A centralised dashboard should give your agency one place to see website uptime, API health, SSL certificates, server availability, and cron jobs. The important distinction is that client organisation should happen within the dashboard itself, rather than through a collection of unrelated tools.
When evaluating an API monitoring platform, look for:
- Client-level workspaces, tags, or groups
- Authenticated API checks with secure credential storage
- HTTP method and response-body validation
- Latency and error-rate tracking
- Multi-region monitoring
- Alert routing and escalation rules
- Branded or white-label status pages
- Automated uptime and API reports
- Data export and API access
- Role-based permissions and audit history
This checklist helps ensure that centralisation actually reduces operational work. A dashboard that only sends basic URL pings may look tidy but still leave your agency exposed to silent API failures.
Organising API Monitors by Client So Nothing Slips Through
Once the dashboard is set up, organisation is what saves you day to day. A few things that consistently work well include:
- Tag or group monitors by client name, project, and contract tier. Obvious in theory, easy to skip, and exactly how things get messy at scale.
- Use a consistent naming convention from day one. Something like “ClientName / Environment / Service / Method / Purpose” — for example, “Acme / Production / Payments-API / POST / Health” — tells you everything at a glance. “Server 4” tells you nothing.
- Separate staging from production, always. You don't want a staging alert firing during a live client demo.
- Group by monitor type within each client — API checks together, uptime checks together, SSL monitoring together, and cron jobs together — so troubleshooting is a quick scan rather than a scavenger hunt.
- Control who can see, edit, and acknowledge what. Not everyone on your team needs edit access to every client's monitors, and clients should never be able to see another client's data through a shared workspace or misconfigured status page. Set up role-based permissions so junior team members can acknowledge alerts without being able to delete a monitor, and keep an audit trail of who changed what. It matters when a client asks why an alert didn't fire.
- Build offboarding into the process, not just onboarding. When a client leaves, archive or export their historical data, revoke their status page access, and remove their credentials from your secrets manager. It's an easy step to forget when you're focused on bringing new clients in.
- Revisit your structure every quarter. What works cleanly for five clients can turn into a tangle at 25.
This isn't glamorous work, but it's the difference between a dashboard that helps you and one that adds more visual noise to your day.
How to Deliver a Branded Status Page for Clients
Clients don't want to raise a support ticket every time they're curious about site or API health. They want to glance at a page and know for themselves.
A branded status page solves this well, but a few decisions are worth making deliberately rather than defaulting into. First, public versus private: a public page is great for general uptime, but if an incident involves sensitive details — a data issue, a security patch, or specifics about a client's backend — you'll want either a private, access-controlled page or a public one with deliberately vague incident notes.
Second, decide who owns the content on it: is your team writing incident updates, or does the client want editorial control? Third, check what your platform actually supports for custom domains, logo and colour customisation, component-level status (so a client sees “Payments API” and “Website” as separate rows rather than one blended status), and access restrictions. These features vary meaningfully between providers and even between plans on the same provider.
Setting up a status page typically takes longer than the marketing copy suggests. Budget time for domain verification, including pointing a CNAME record and waiting for it to propagate, choosing which monitors to expose publicly, and agreeing incident-wording conventions with your team so nobody improvises a vague update mid-incident. Once that groundwork is done, adding a new client to an existing status-page template is quick.
Done well, a status page changes the dynamic from “is it down?” messages landing in your inbox at inconvenient hours to a client checking a page with their own branding and moving on with their day. It also builds trust during real incidents: “we're aware, we're investigating, here's the timeline” beats silence every time. Clients tend to forgive downtime far more easily when they can see you're on top of it. Some agencies also use a strong month of public uptime numbers as a quiet, ongoing proof point for the reliability a client is paying for.
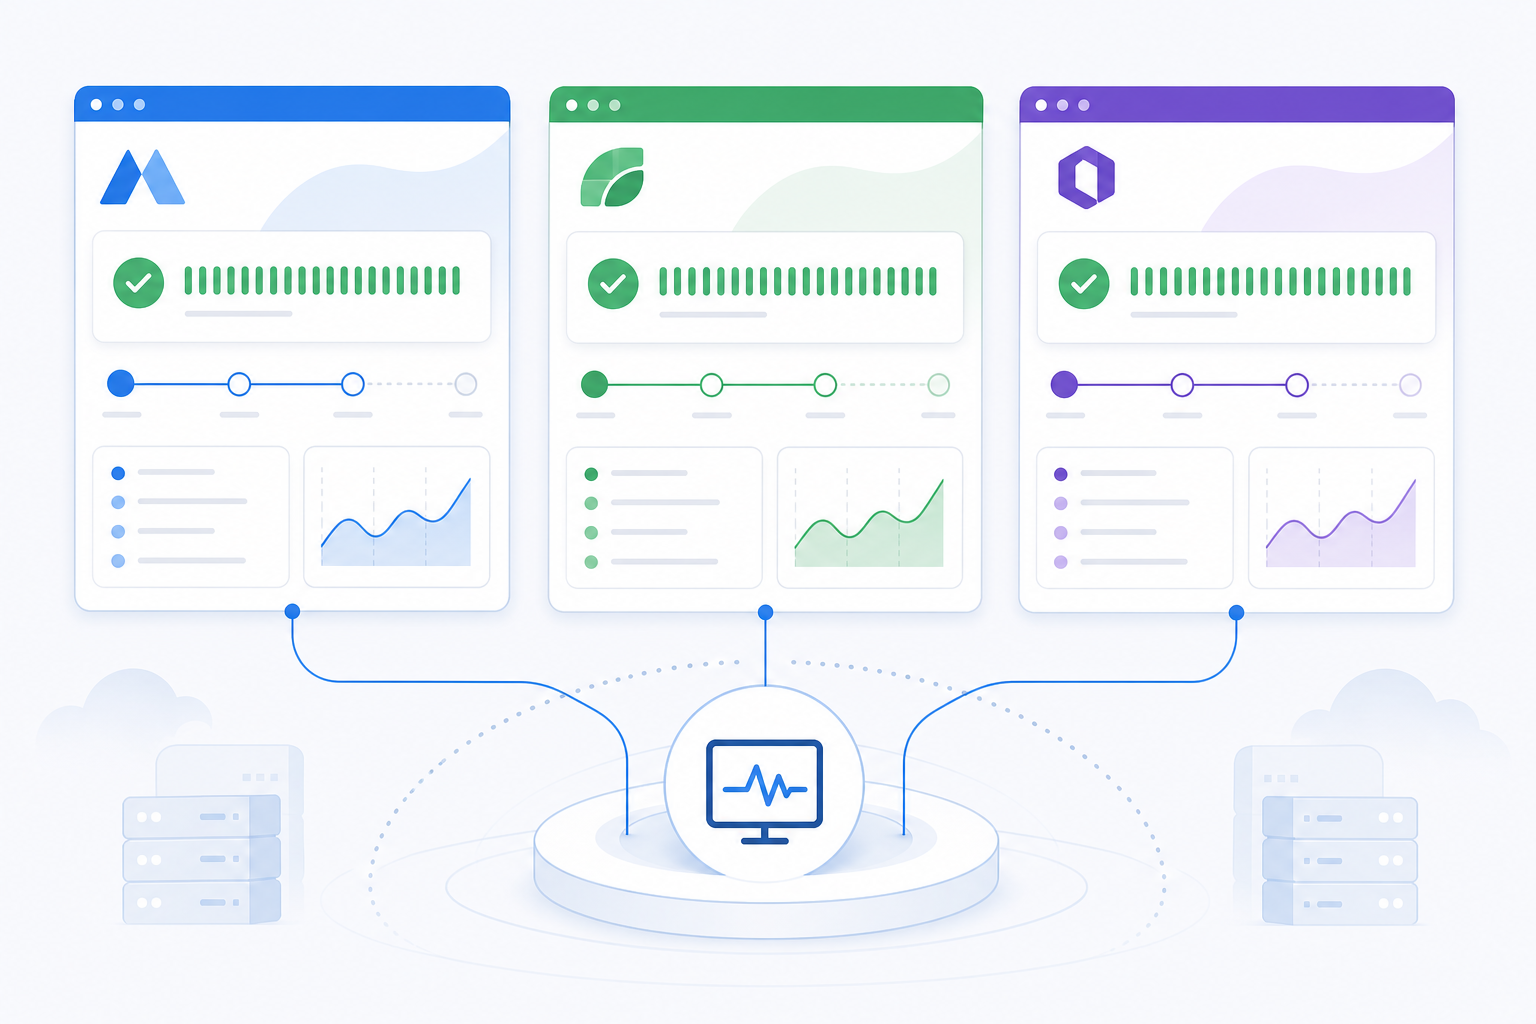 Suggested alt text: Three branded client status pages with different logos and colour schemes, built from the same underlying monitoring data.
Automating API Monitoring Alerts Without the Noise
Centralising your monitoring is only half the battle. The other half is making sure alerts reach the right people without burying your whole team in noise.
A practical way to think about this is a tiered escalation policy rather than a single alert rule for everything:
| Monitor type | Failure threshold | First alert | Escalation |
|---|---|---|---|
| Production API, top-tier client | 2 consecutive failures, multi-region | On-call engineer, immediately | Team lead after 10 minutes unacknowledged |
| Production website | 3 consecutive failures | On-call engineer | Team lead after 15 minutes |
| Staging environment | 5 consecutive failures | Slack channel, no page | None — business hours only |
| SSL certificate expiry | 14 days out | Email to account owner | Second reminder at 3 days |
| Cron job failure | 1 missed run | Slack channel | Escalate if 2 runs missed |
Around that structure, a few principles matter:
- Use retries and consecutive-failure thresholds, not single-check alerts. Two or three consecutive failures, ideally verified across regions, filters out transient blips.
- Build maintenance windows into the workflow. If a client's development team is deploying, suppress alerts for that window rather than waking someone up over an expected blip.
- Deduplicate related alerts, so one API outage doesn't generate 15 separate notifications across dependent checks.
- Use the integrations your team already lives in — Slack, Discord, Telegram, or webhooks.
- Match escalation speed to actual risk, not a blanket rule across all clients.
If you're managing UK-based clients or team members, build these thresholds around actual UK working patterns rather than assuming an always-on culture applies by default. Consider bank holidays, an on-call rota that doesn't quietly rely on the same person every weekend, and clear coverage during evenings when most UK agencies genuinely aren't staffed.
It's also worth thinking about what data your API checks are logging. If a payload includes anything resembling personal data, even in a test transaction, keep that handling GDPR-conscious and avoid storing full request bodies in monitoring logs for longer than necessary. If you're monitoring UK-hosted infrastructure from checkpoints based elsewhere, factor in that cross-border latency can occasionally look like a performance regression that isn't really one.
Trust compounds either way. When your team knows an alert is almost always real, they respond faster. When alerts are noisy, people start tuning them out — and that's exactly when something serious slips through.
How to Report API and Uptime Performance to Clients
Eventually, every client wants to know: was it worth what I paid you? A good report needs to cover more than a single uptime percentage, especially for API-dependent clients. A solid monthly API monitoring and uptime report typically includes:
- Overall uptime percentage for the period
- API availability specifically, separate from general website uptime
- Response-time trends, including a p95 figure rather than just an average, since averages hide the slow outliers customers actually notice
- Error-rate trends for API endpoints, not just binary up/down status
- Incident history with timestamps, resolution times, and the specific endpoint or service affected
- SSL certificate and domain expiry status
- SLA compliance, where you've committed to one, with agreed exclusions clearly noted
That last point matters more than it looks. If a client's SLA excludes planned maintenance windows or third-party dependency outages, say so explicitly in the report rather than letting a dip in the number speak for itself. Otherwise, you'll spend more time explaining the exclusion after the fact than it would have taken to include it. The same goes for monitoring gaps: if a check was paused during a migration, note it rather than letting a clean-looking report imply coverage that wasn't actually there.
It's also worth being upfront that uptime percentage alone can be misleading. A site can show 99.9% uptime while its API quietly returns slow or partially broken responses the whole time. Breaking out API-specific metrics is what demonstrates the reliability a client is paying for.
| Manual Reporting | Automated Reporting | |
|---|---|---|
| Time required | Hours per client, per month | Minutes, pulled straight from the dashboard |
| Report fields | Whatever you remember to include | Uptime, API availability, p95 latency, error rate, incidents, SSL status, SLA compliance |
| Accuracy | Prone to human error, screenshots, and guesswork | Pulled directly from monitoring data |
| Consistency | Varies by who's writing it | Same format, every client, every month |
When reporting comes straight from your monitoring platform, it stops being a chore you dread at month-end and becomes something that actively strengthens the client relationship.
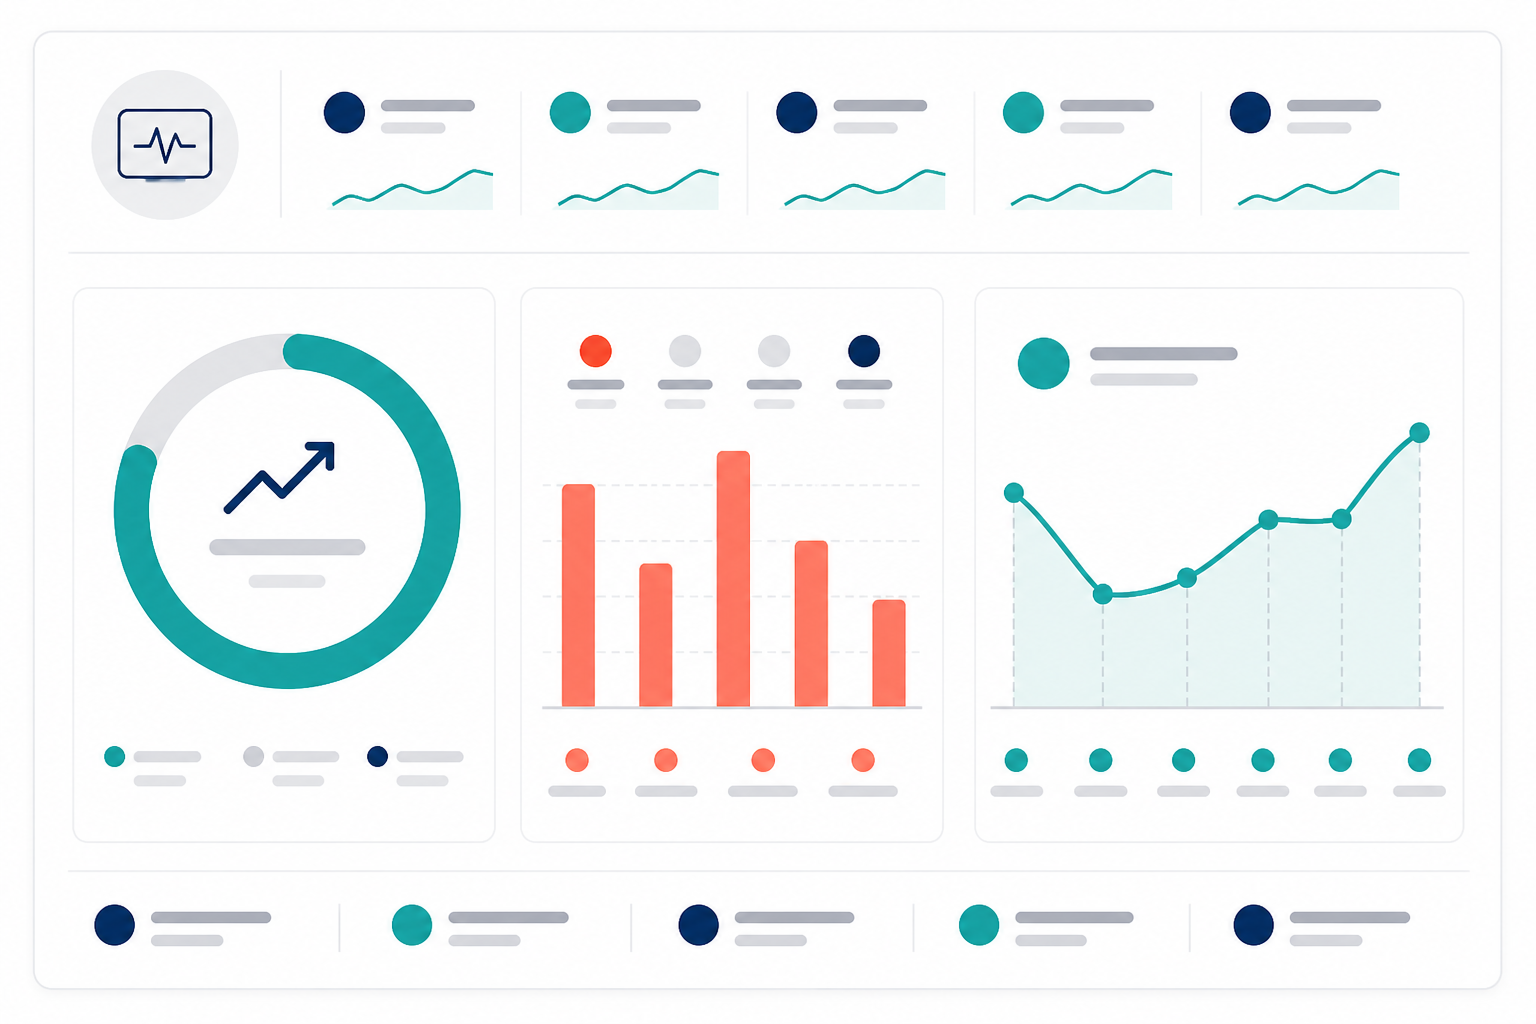 Suggested alt text: A client-facing monthly report showing uptime percentage, API response-time trend, and incident count in a clean chart format.
API Monitoring for Agencies: Frequently Asked Questions
Can one agency account handle API monitoring for dozens of separate clients?
Yes, provided the platform supports proper client-level organisation through tagging, grouping, or workspace separation and doesn't cap you at a low number of monitors. Check the specific monitor allowance on your plan, and confirm it covers the API-specific checks you need, including HTTP methods, authentication, response-body validation, and dependency tracking — not just basic uptime pings.
Can I give each client their own branded status page?
Usually, yes, if your monitoring platform supports branded status pages, custom domains, and client-level separation. Confirm in advance whether it supports each client's logo, colours, component-level status, access controls, and custom domain. Not every provider offers full white-labelling by default, and you should factor domain verification time into your client onboarding process.
How do I avoid alert fatigue when managing many client APIs?
Combine multi-region verification with consecutive-failure thresholds, maintenance windows during known deployments, and alert deduplication so one incident doesn't generate a flood of separate notifications. A tiered escalation policy — with different rules for production versus staging and top-tier versus standard clients — does more to reduce alert fatigue than any single setting.
How can I monitor an authenticated API without exposing credentials or triggering real transactions?
Store test credentials in your platform's secrets manager rather than in the monitor configuration itself. Use scoped API keys or test-mode tokens with the narrowest permissions that still let you check the endpoint, and rotate them on a schedule. Wherever possible, use a dedicated test route or synthetic and sandboxed data rather than real customer records. Avoid destructive methods such as POST or PUT against production data unless the endpoint is specifically designed to accept and discard test transactions.
What's the best way to prove API reliability to clients who don't understand the technical details?
Keep it simple: provide an overall uptime percentage, API-specific availability, a p95 response-time trend, and a short incident history showing what was affected and how long it took to resolve. Clients don't need raw data; they need to see the reliability they're paying for, with enough detail to show you're tracking more than “is the URL reachable?”.
Is a dedicated API monitoring platform better than building monitoring in-house?
For most agencies managing more than a handful of clients, a dedicated platform is worth considering, but the payback period depends heavily on your setup. If you're currently spending several hours a month on manual reporting across ten or more clients, a platform can often pay for itself within a couple of months once you factor in time saved and fewer false-alarm investigations. If you're managing two or three clients with simple needs, the maths is less clear-cut, so run your own numbers rather than assuming a universal payback period.
Bringing It Together: A Scalable API Monitoring Process for Agencies
If your Mondays currently look anything like the scenario at the start of this guide, here's the short version of what to change:
- Pick one platform that covers real API health checks, not just uptime pings.
- Build a repeatable onboarding routine for each new client rather than creating a fresh setup every time.
- Organise monitors with a consistent naming convention and proper permission controls.
- Give each client a branded status page, with a clear public or private decision made upfront.
- Set escalation rules by risk tier rather than using one blanket policy.
- Automate reporting so it includes API-specific metrics, not just a single uptime number.
I use Moonitor for this across the agency work I do. Client-level tagging, API assertions with response-body checks, multi-region failure verification, branded status pages with custom domains, and data export all sit under one account. That is what makes the operating model above workable day to day.
Moonitor offers a free trial if you want to test it against your own client list. Check the current plan details for monitor limits and status-page features, since those can change. A trial should give you enough time to set up a few client API monitors, build a branded status page, and see whether centralising API monitoring saves the time and stress it promises.