
How to Prove SLA Compliance to Clients Using Response-Time Analytics
Learn how agencies use response-time analytics, uptime reports and incident history to prove SLA compliance, defend against complaints, and win renewa
How Response Time Analytics Prove SLA Compliance to Clients
The fastest way to prove SLA compliance is to let your monitoring data do the talking. Pull response time analytics, uptime percentages and incident history directly from your monitoring dashboard into a client-ready report. Timestamped, multi-region data will not guarantee every renewal goes smoothly, but it makes SLA conversations faster, more transparent and much easier for both you and the client to verify.
I remember a call where a client insisted their site had been “down most of Monday”. We pulled up the dashboard together: one seven-minute outage, flagged and resolved before their support team had even opened a ticket. That was the whole conversation, settled in the time it takes to open a tab. Without that record, it would have been memory versus memory — a half-remembered Slack thread against a client’s frustrated recollection. That is not a position anyone should have to argue from, and it is exactly the position response time analytics are built to remove.
SLA compliance reporting means measuring your service against the specific thresholds written into the contract — uptime percentage, response time targets and agreed exclusions such as planned maintenance — then presenting that measurement so the client can verify it themselves. It is related to general performance monitoring, but narrower and more contractual. This post explains how to build that evidence base properly: what to measure, how to report it and how to use it in renewal conversations.
Why SLA Compliance Proof Matters in Client Relationships
Clients do not see your server logs. They do not know that last month’s three-minute blip was a regional network issue with their hosting provider, rather than a problem with your code. What sticks in memory is the one bad week, not the 51 good ones. Human memory clings to the anomaly and quietly erases the routine — which means that without data, you are often arguing against a distorted version of events rather than the real one.
A clear, objective record rebalances that. Instead of a client’s gut feeling about “how reliable things felt”, you are handing them timestamped facts. Agencies that report proactively — before the client has to ask — also tend to be seen differently: as partners managing infrastructure thoughtfully, rather than vendors who need chasing. That is the difference between a client who renews because they have to and one who renews because they trust you.
One principle is worth keeping in front of you throughout this process: monitoring data tells you what happened. It does not automatically tell you why. Good SLA compliance reporting is built on that distinction, which is why the sections below cover both the evidence itself and how to corroborate it.
What Do Response Time Analytics Actually Show?
Uptime percentage gets most of the attention in SLA conversations because it is a clean, simple number. “We were up 99.98% of the time” sounds great on a slide. But uptime alone tells an incomplete story. If that is all you report, you are leaving useful evidence — and useful early warnings — on the table.
Before reporting any response time figure, know exactly which one your contract measures. These metrics are not interchangeable:
- Synthetic check latency — how long a monitoring tool’s request takes to receive a response from an endpoint. It is fast and consistent to measure, but does not capture everything a real visitor experiences.
- API or transaction latency — the time a specific call or process takes, useful when the SLA covers a backend service rather than a webpage.
- Full page load time — closer to what a human notices, but affected by more variables outside your control.
- Real-user monitoring (RUM) — actual visitor experience data, which is richer but less standardised across tools.
If your SLA does not specify which of these it means, clarify this with the client before your first report goes out. It is a much easier conversation to have proactively than after a dispute.
With that settled, response time analytics fill in what uptime alone cannot show:
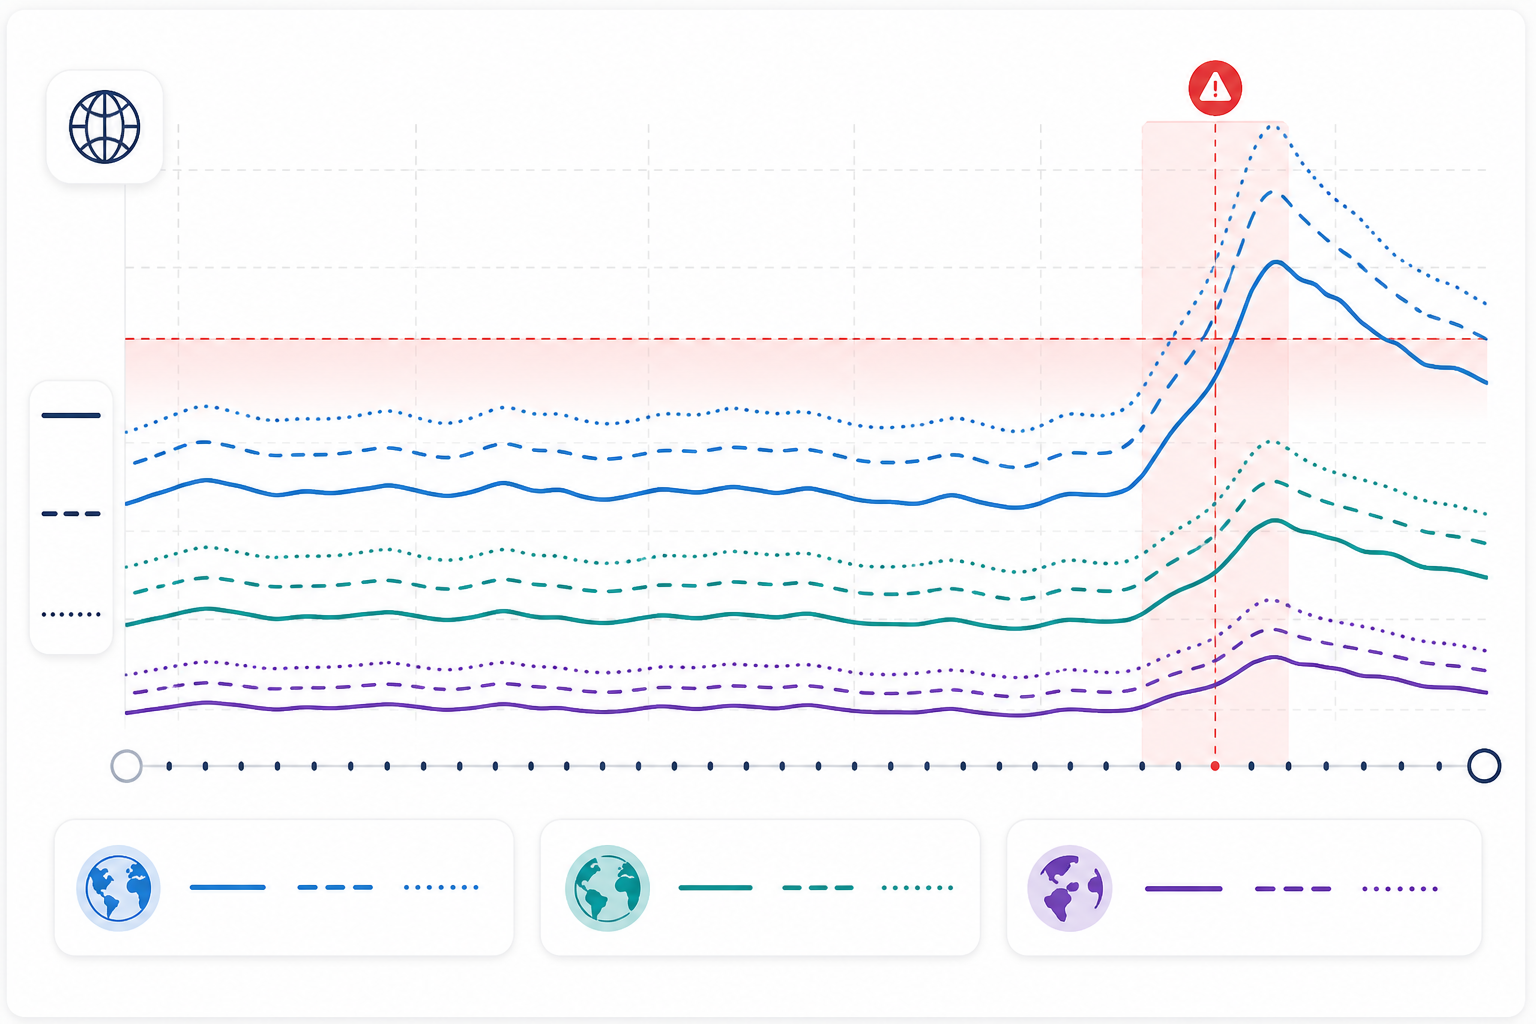
- Average and percentile response times reveal degradation long before it becomes downtime. A site that is technically “up” but takes eight seconds to load is still failing users. Averages can hide the worst experiences, though, because a handful of slow requests can be buried in an otherwise healthy average. Percentile figures such as p95 or p99 — the response time that 95% or 99% of requests fall under — are usually more honest indicators. A rising p95 trend can flag an SLA risk weeks before an actual breach appears in the uptime figure.
- Per-region response data shows whether slowness is global or localised to one network path. That creates a very different client conversation from simply saying “the whole site was slow”.
- Trend lines over weeks or months show consistency rather than relying on a single snapshot. Anyone can cherry-pick a good day; a steady trend across a full quarter is much harder to dispute.
- Response time spikes correlated with incident timestamps help separate “slow” from “down” — two different realities that frustrated clients often group together.
A Quick Moonitor Workflow for Response Time Reporting
This is exactly the workflow tools such as Moonitor are built to support, and it is worth walking through concretely:
- Create a monitor group for the client, covering their website, key API endpoints and any integrations named in the SLA.
- Select check locations that match where the client’s real users are, rather than relying only on your default region.
- Set thresholds and alert rules against the contract’s actual numbers, not generic defaults.
- Let the monitors run and check the incident log periodically, rather than only when something breaks.
- When the reporting period ends, export the data by client or monitor group and add it to your report or branded status page.
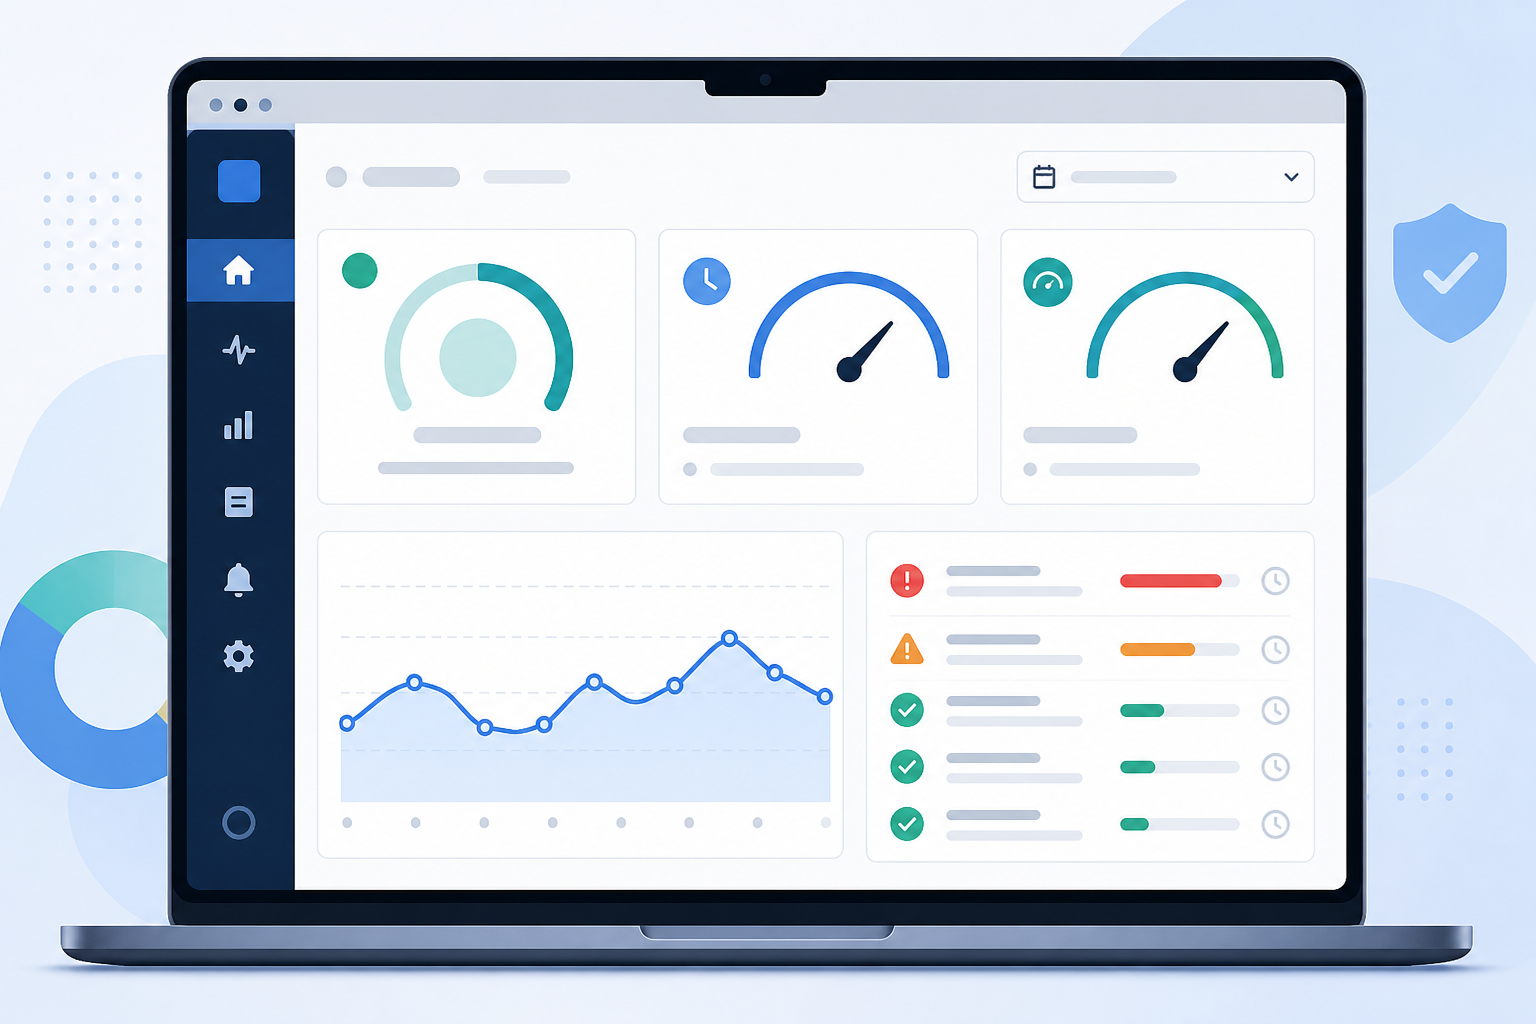
Instead of stitching numbers together from five tools before a client meeting, you open one dashboard and the period’s data is already there. If you have not set this up for a client yet, build the monitor group, set the thresholds and generate your first report before the next renewal conversation — not during it.
How to Build Client-Ready Uptime Reports
Once the right data is flowing in, the next step is packaging it so it makes sense to a client who is not going to examine raw logs. Use this repeatable process for accurate uptime reports and client reporting:
- Choose the monitors relevant to that specific client — their website, key API endpoints and critical integrations named in the contract. Do not bury them in unrelated data.
- Define the reporting window to match the SLA terms exactly, and check which time zone the contract assumes. A monthly period defined in UTC can look different from one defined in UK local time, especially around clock changes.
- Confirm exclusions and maintenance windows before calculating anything. Most SLAs exclude planned maintenance and sometimes third-party outages, but only if the wording says so explicitly.
Worked example: The SLA target is 99.9% uptime over a 30-day month — 43,200 minutes — measured in UK local time and excluding a pre-agreed maintenance window. Total downtime for the month is 30 minutes, all outside the maintenance window. That leaves 43,170 minutes of uptime, or 99.93%: a pass against the 99.9% target, with headroom of about 13 minutes. Average response time is 240ms. P95 response time is 410ms. There is one incident lasting 30 minutes, with the root cause recorded as an upstream DNS provider outage and corroborated by the provider’s own status page. That is a complete, defensible report in five data points.
- Include uptime percentage alongside average and percentile response times, rather than uptime alone. This is one of the biggest upgrades most agencies can make to client reporting.
- Add incident history with root-cause notes, so nothing looks unexplained. A gap in the record raises more suspicion than an incident with a clear explanation attached.
- Export via API or share a branded public status page for ongoing transparency. Some clients want a polished monthly PDF; others want to check the data themselves. Be clear about how long historical data is retained, since that affects what you can prove months later.
- Send the report before the client asks. This is the step agencies skip most often, and it often has the biggest payoff.
Before any report goes out, run a quick validation pass:
- Do your monitor locations match where the client’s users actually are?
- Is your check interval tight enough to catch the shortest outage your SLA needs to detect?
- Are alerts confirmed by a second check before they count as an incident, so a single dropped ping does not get logged as downtime?
- Is your dashboard clock synchronised with the time zone used in the contract?
A dashboard is only evidence when its configuration matches what the SLA promises to measure. Automation does not create contractual validity on its own; correct setup does.
Can Monitoring Data Defend Against Unfair Client Complaints?
Sometimes a client complains about something that genuinely was not your fault, or was not as serious as they remember. A client’s own connection may hiccup for ten minutes, while “the site was down all morning” becomes the story they repeat in their next internal meeting.
Multi-region monitoring helps, but be precise about what it proves. Checking from several locations before flagging an outage reduces false positives caused by a single regional blip. It tells you whether an issue was widespread or localised. What it does not prove on its own is why something happened. If an outage was visible only from one region and that region correlates with the client’s office network, that is a strong clue — not automatic proof. Pairing it with the client’s ISP status or your hosting provider’s incident log turns a clue into a stronger case.
Timestamped incident history is more direct. When a client says “it was down all day”, you can show the exact start time, end time, duration and resolution notes. Often, “all day” turns out to be 12 minutes — provided that your monitoring interval was tight enough to record it accurately.
Response time data adds another layer. Sometimes the client’s site is running normally, but a third-party API or CDN is the actual bottleneck. Showing that “your site responded in 180ms, but this external service caused the delay” moves the conversation from blame to problem-solving. It is still worth checking the third party’s own status page to corroborate the explanation.
How to Turn SLA Reports Into Renewal Conversations
Many agencies treat SLA reporting as a compliance checkbox rather than part of the sales conversation. Flip that framing: every report is evidence of value delivered. “Here is what we kept reliable for you this month” lands very differently from a dry attachment with no context.
A consistent reporting cadence builds a record of reliability across the contract term. By renewal time, you can point to months of evidence that is already available, rather than trying to convince the client of something new. A simple three-part narrative works well:
- The SLA result: “99.97% uptime against a 99.9% target.”
- The improvement: “Average response time reduced from 420ms to 260ms since Q1.”
- The recommended next step: “It would be worth adding cron job monitoring to the backend jobs we flagged.”
This same data often reveals upsell opportunities that can be quantified rather than simply mentioned. If a client’s backend jobs failed silently three times in a quarter, that is a concrete case for cron job monitoring — not a vague “you might want this”. An SSL certificate that came within four days of expiring before you caught it is a specific, dated reason to discuss certificate monitoring. Tie each suggestion to a number and a date, and it reads as risk management rather than a sales pitch.
Manual Reporting vs Automated Monitoring Reports
| Manual Reporting | Automated Monitoring Reports | |
|---|---|---|
| Process | Screenshots and spreadsheets pulled together under deadline pressure | A centralised dashboard pulls uptime, response time and incident history on demand or on a schedule |
| Accuracy | Prone to gaps, copy-and-paste errors and missed incidents | Consistent, automated collection — assuming monitors and intervals are configured correctly |
| Dispute defence | Little historical record if a client disputes a past incident | Incident history and exports make disputes easier to resolve, provided retention periods cover the disputed date |
| Scalability | Falls apart quickly across dozens of client sites | Scales across many client sites with far less administrative overhead |
| Time cost | Hours per client, every reporting cycle | Minutes, since the data is already current |
Worth remembering: automation does not make your data complete by default. Wrong check locations, loose alert thresholds or a monitoring interval longer than your shortest outage will still produce a misleading report. The tool removes manual labour, not the need to check that the setup matches the contract.
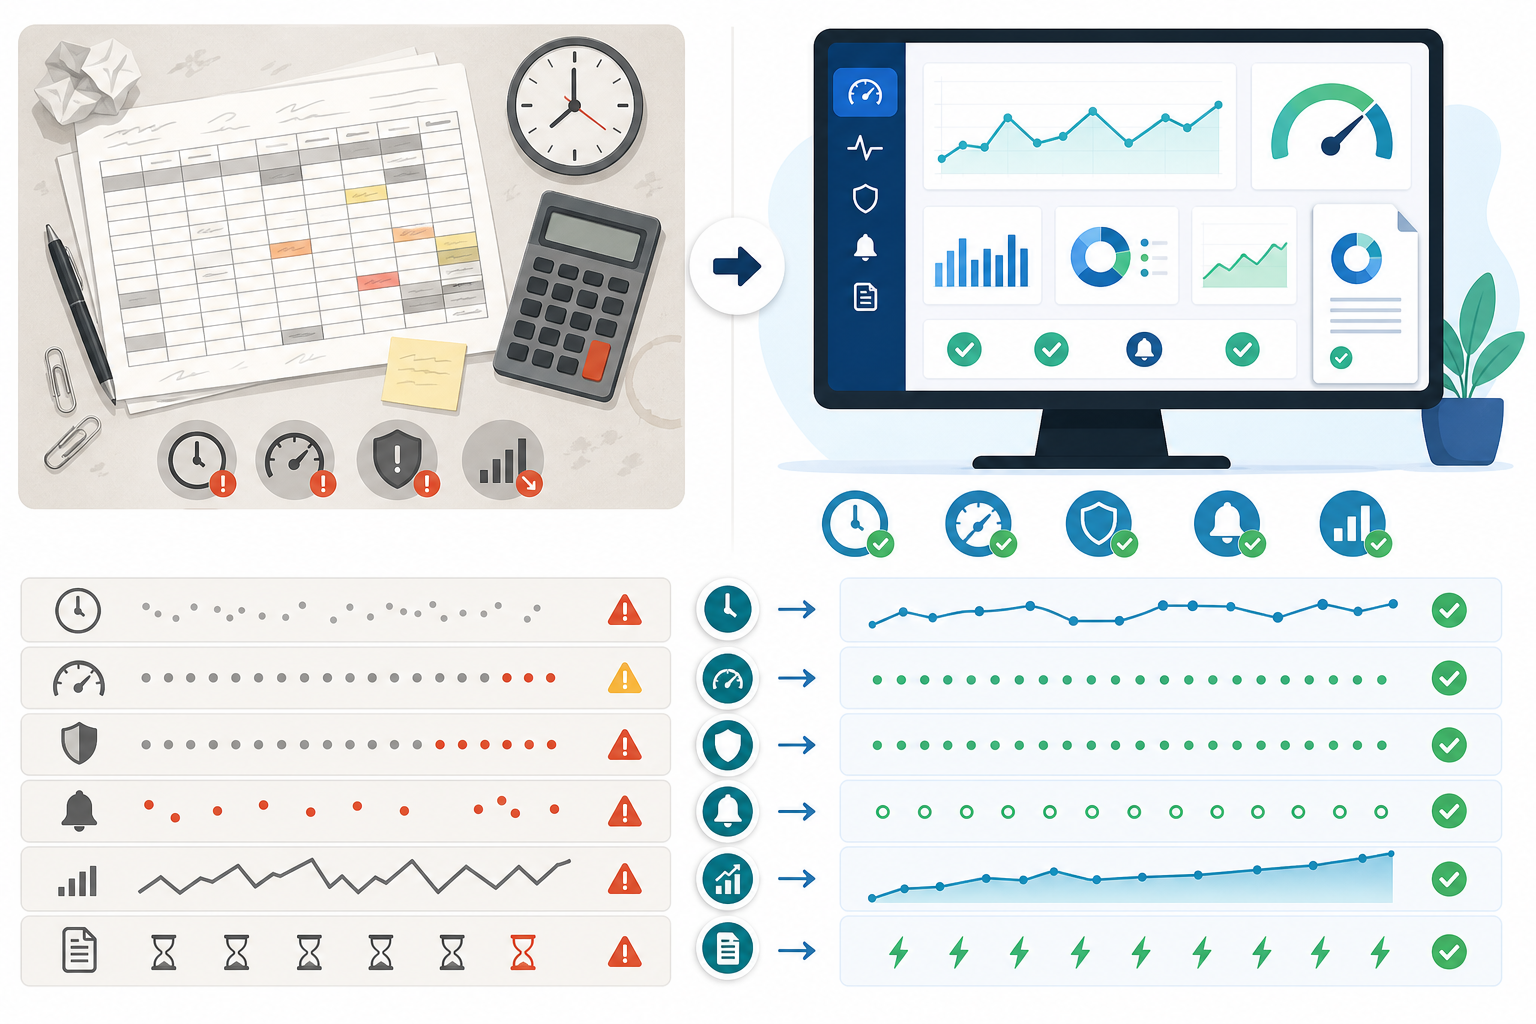
For agencies specifically, the scalability row matters most. Managing SLA reporting for three clients manually is annoying but survivable. For 30, it becomes a part-time job nobody signed up for.
If you are a UK-based agency, confirm a few contract-specific details before relying fully on automation:
- Whether the SLA defines uptime and response time targets in UTC or UK local time, including how this is handled around BST clock changes.
- What counts as a qualifying incident for service credits under the contract.
- Whether the client’s procurement process has its own reporting or evidencing requirements.
- How long you are contractually obliged to retain reporting data.
None of this is exotic, but these details turn a good dashboard into evidence that can hold up if a service-credit claim is contested.
Frequently Asked Questions About SLA Compliance Reporting
How Do I Prove SLA Compliance to a Client?
Pull the uptime percentage, response time analytics and incident history for the relevant reporting period directly from your monitoring tool. Check the figures against the exact thresholds and exclusions written into the contract, then present them in a simple report or branded status page so the client sees objective, timestamped evidence rather than a verbal assurance.
What Analytics Should I Include in a Client Uptime Report?
At minimum, include uptime percentage, average and percentile response times — p95 or p99 — against the specific metric defined by your contract. Add a summary of incidents with their duration and cause. Multi-region data is a strong addition because it shows whether an issue was widespread or isolated, although root-cause claims are stronger when corroborated by provider or client-side evidence.
Can Monitoring Data Help Defend Against Client Complaints?
Yes, in most cases. Timestamped incident logs and multi-region checks show what happened, when it happened and how long it lasted, turning vague complaints into quicker, evidence-based conversations. They are less conclusive about root cause on their own, so correlate your monitoring data with hosting provider logs, third-party status pages or the client’s own network information.
What If My Dashboard’s Default Response Time Metric Does Not Match the Contract?
Check whether the SLA specifies synthetic check latency, API response time or full page load time. If your monitoring tool defaults to something different, reconfigure the monitor to match or clearly label the metric you are reporting and explain the difference to the client. Reporting the wrong metric consistently, even accurately, can still create a dispute later.
How Long Should I Retain SLA Evidence?
Retain it long enough to cover any realistic dispute window. Many agencies keep at least 12 months of incident and response time history, although some UK client contracts specify their own retention requirements. Check the contract rather than assuming your monitoring tool’s default retention period is sufficient.
Is a Public Status Page Enough Without a Formal Report?
For ongoing transparency, often yes. A public status page gives clients a self-service way to check service status. For formal SLA compliance and service-credit claims, it is better paired with a period-specific report stating the exact target, measurement window and result. A status page alone may not capture historical exclusions or root-cause notes.
How Is Uptime Percentage Calculated for an SLA?
Use this formula:
Uptime percentage = (total minutes in the period − downtime minutes) ÷ total minutes in the period × 100
A 99.9% monthly target over a 30-day month allows roughly 43 minutes of downtime. Always check what your contract excludes. Planned maintenance and certain third-party outages are common exclusions, but only when the contract wording says so.
How Often Should Monitoring Checks Run to Support SLA Reporting?
This depends on the SLA’s required granularity, but checks every one to five minutes are typical for client-facing sites. If your interval is longer than the shortest outage you need to detect, you risk under-reporting downtime. That can undermine the report’s credibility if a client’s own logs show an incident your dashboard missed.
SLA compliance reporting is not about ticking a box for an anxious client on a Monday morning. It is about protecting the trust you have built, backed by evidence rather than assumptions — while being honest about what that evidence can and cannot prove on its own.
If you are not already doing this for at least one client, take the practical next step: build a monitor group that matches their SLA terms, run it for one full reporting period and send the report before they ask. When your response time analytics, uptime reports and incident history live in one place and update automatically, renewal season becomes a conversation about growth far more often than a conversation defending your track record.