
How to Monitor a REST API Beyond a Simple 200 Status Check
Learn how to monitor a REST API beyond a 200 check: test database health, validate response data, set sensible timeouts and reduce alert noise.

How to Monitor a REST API Beyond a 200 Status Check
If you want to monitor a REST API properly, don't stop at checking for a 200. Build a health endpoint that actually exercises your critical dependencies (like the database), validate the response body as well as the status code, set timeouts and latency thresholds based on your own measured baseline, and only page someone after a failure has been confirmed from more than one location. That combination catches the failures your users feel, without waking you up for blips.
I'll walk you through how we'd do that, step by step, using a realistic example. Grab a cup of tea. It's less work than it sounds. ☕
Why a 200 response doesn't prove your REST API is healthy
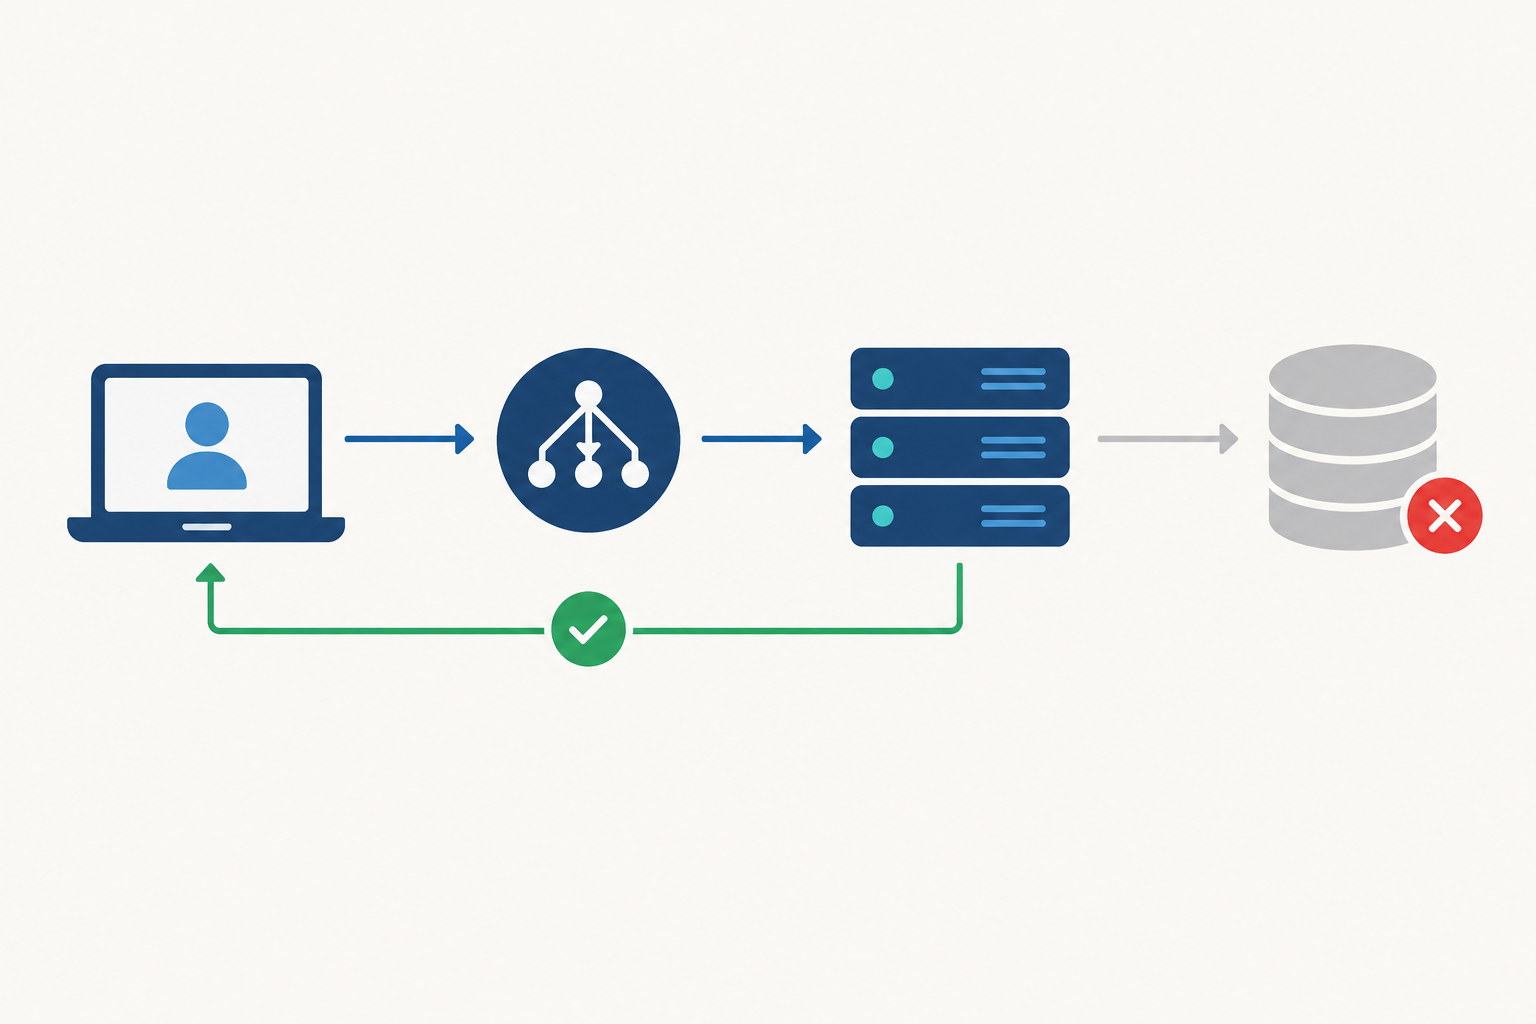
Picture this. It's a Tuesday afternoon, and your monitoring dashboard is a calm wall of green. Meanwhile, customers are opening your app and seeing... nothing. Empty lists. No orders, no products. Your API has been happily returning 200 OK with an empty array for the best part of an hour, because the database went away and a cache layer kept serving a hollow fallback response. Nobody was paged, because technically nothing was "down".
I've seen versions of this story more than once, and the lesson is always the same: the monitor was answering the wrong question. It asked "did something respond?" when it should have asked "would a real user have a good time right now?"
Our example REST API
To keep things concrete, we'll use a small orders service. Think Node (Express) or Python (FastAPI), your pick, since the ideas are identical. It's backed by PostgreSQL for data and Redis as a cache. Endpoints include GET /v1/orders/:id, a GET /v1/status resource and a /health endpoint we're about to design.
Ways a 200 status code can lie
- A load balancer or CDN serves a cached or fallback page. The origin could be on fire and the edge still says 200.
- The framework returns 200 with an error payload, something like
{"error": "db unavailable"}wrapped in a success code. - The app is up, but the database connection pool is exhausted. The process is alive, yet every real request hangs or fails.
- A degraded dependency is masked by retries. Everything technically works, just slowly and unreliably.
So our goal is a check that fails when a real user would have a bad time. Basic uptime monitoring still matters, since you need to know your endpoint is reachable from the outside, on a schedule. We're not replacing it, just building on top of it.
Designing a meaningful health endpoint to monitor a REST API
The health endpoint is where most of the value lives. Get this right and everything else gets easier. Here's how I'd build it.
Step 1: Separate liveness from readiness
Liveness asks "is the process running?" Readiness asks "can it actually do its job?" Orchestrators like Kubernetes use liveness to decide whether to restart a container, and you generally don't want a database blip causing restarts. External monitoring should hit the readiness-style check, because that's the one that reflects user experience.
Step 2: Run a cheap, real query (and know what it proves)
Have the endpoint run SELECT 1 against PostgreSQL. That's a good start, but be clear about what it tells you: the database accepted a connection and answered a trivial query. It does not prove that the orders table exists, that your app's database user has the right permissions, or that customers are getting correct data back.
If you want a stronger signal, swap in a lightweight read on a table the service genuinely depends on, such as SELECT id FROM orders LIMIT 1, and keep it cheap. Either way, pair the health endpoint with a separate business-endpoint check (more on that shortly) so you cover the real user path as well as the plumbing.
Step 3: Check critical dependencies only
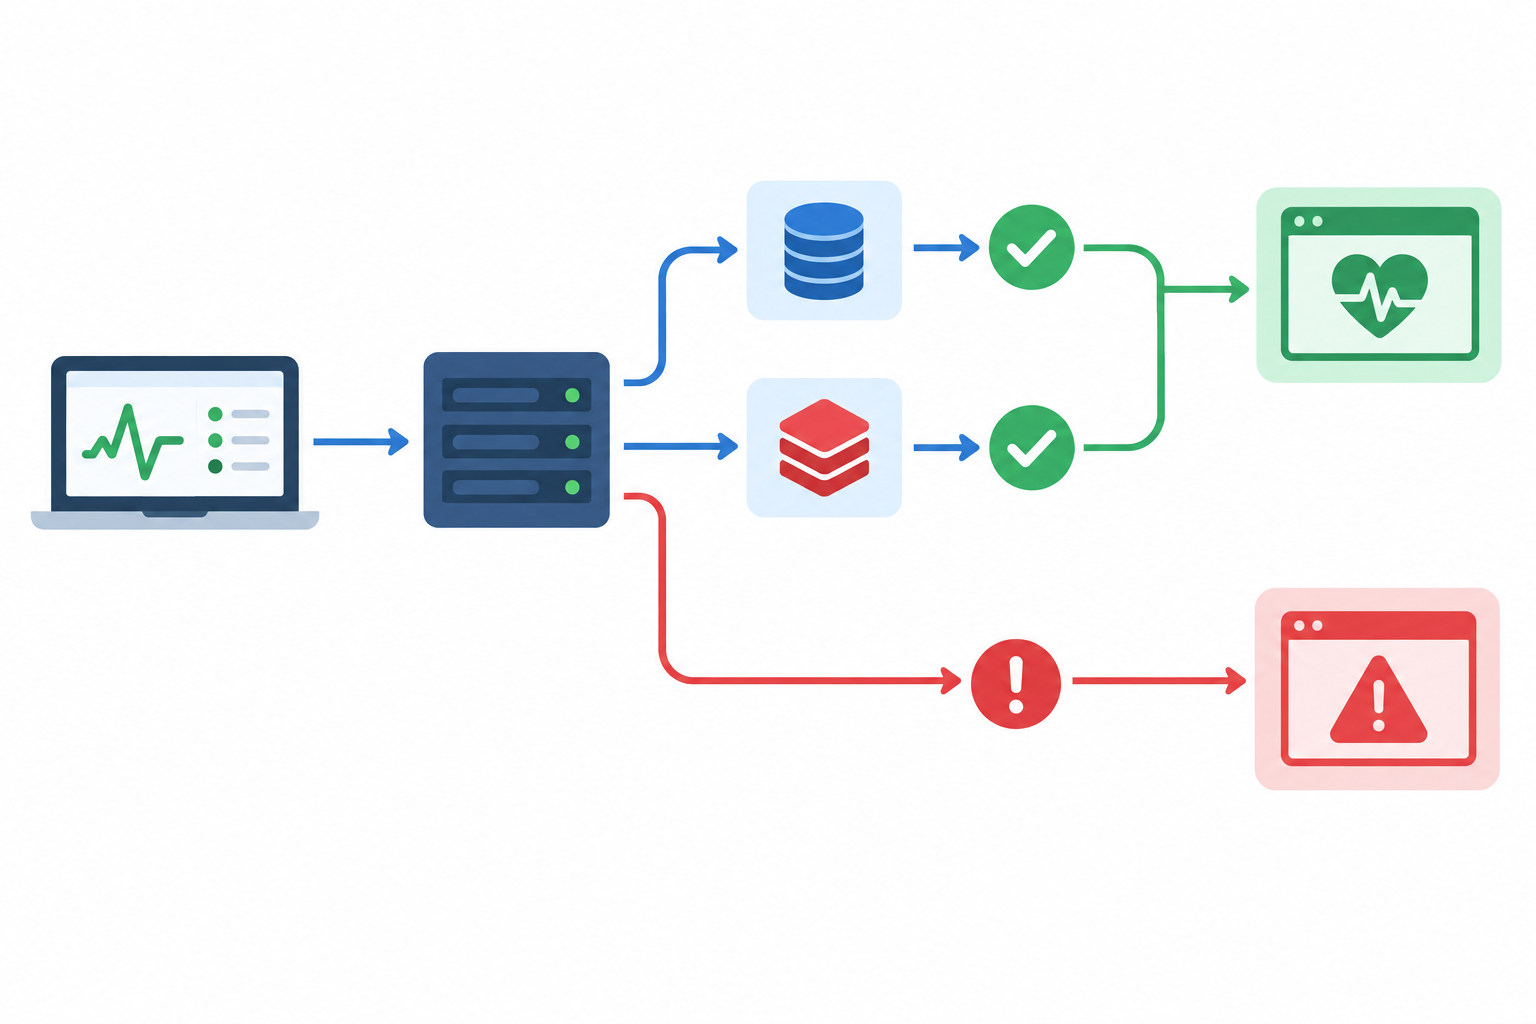
Decide what counts as "fail" and what's merely "degraded". In our orders service, PostgreSQL is critical: no database, no orders. Redis is a performance layer, so if it's down we're slower but still functional. That's degraded, not failed. A good rule of thumb: if users can still complete their task, it isn't a hard failure.
This decision matters later, because it determines who gets woken up. A database outage should page someone. A Redis outage should send a message to a team channel. We'll wire that up in the alerting section.
Step 4: Return 503 when a critical dependency fails
Don't return 200 with a "status": "error" flag buried in the body. Plenty of tools (and people skimming a dashboard) will only look at the status code. A 503 Service Unavailable is honest and universally understood. For a degraded-but-working state, such as Redis being down, we keep the 200 and say so in the body.
Step 5: Return a small, structured body
Keep it tiny and predictable: status, database, cache, version and timestamp. That's enough to diagnose at a glance and easy to match against later.
A safer Node example
One thing I want to flag before the code. It's tempting to wrap each call in a Promise.race timeout helper, but that only stops waiting. The underlying query keeps running and can hold a connection open. Under a real database problem, a health check hit every minute from several regions could quietly pile up hung work. So we set timeouts on the clients themselves, where the driver can actually cancel or abandon the operation:
const { Pool } = require("pg");
const Redis = require("ioredis");const pool = new Pool({
  connectionString: process.env.DATABASE_URL,
  connectionTimeoutMillis: 1000, // stop waiting for a free connection
  query_timeout: 1500,           // client-side query timeout
  statement_timeout: 1500,       // server cancels the statement
});
const redis = new Redis(process.env.REDIS_URL, {
  connectTimeout: 500,
  commandTimeout: 500,
  maxRetriesPerRequest: 1,
});
app.get("/health", async (req, res) => {
  try {
    const [db, cache] = await Promise.allSettled([
      pool.query("SELECT 1"),
      redis.ping(),
    ]);
const checks = {
  database: db.status === "fulfilled" ? "up" : "down",
  cache: cache.status === "fulfilled" ? "up" : "down",
};

const healthy = checks.database === "up";
const status = !healthy ? "error" : checks.cache === "up" ? "ok" : "degraded";

res.status(healthy ? 200 : 503).json({
  status,
  ...checks,
  version: "1.4.2",
  timestamp: new Date().toISOString(),
});

  } catch (err) {
    // Something unexpected went wrong in the handler itself
    res.status(503).json({
      status: "error",
      timestamp: new Date().toISOString(),
    });
  }
});
Python folks, the same shape works with your driver's own timeouts (asyncpg's command_timeout, for example) rather than relying only on a wrapper around the call.
Notice what happens when Redis dies. The endpoint still returns 200, but status becomes degraded and cache becomes down. That gives us something very useful to match on later.
Health check pitfalls to avoid
The first is making the check too heavy. If your health check runs expensive queries and gets hit every minute from several regions, you've accidentally built your own load test, so keep it cheap. The second is cascading failures. If a non-critical dependency (an email provider, say) can take the whole API down via the health check, you'll trigger outages and restarts that didn't need to happen.
The third is leaking internals. Public health endpoints shouldn't expose hostnames, stack traces or connection strings. If the endpoint is public, drop version too, or move the detailed version behind authentication.
How to check that your API returns the right data
So, how do you check that your API returns the right data? You tell your monitor what "right" looks like, and make it fail when it doesn't. Here's a practical approach.
- Match keywords that map to your severity levels. Match
"database":"up"for the critical check. If you also want to know about a degraded cache, match"cache":"up"in a separate, warning-only monitor. Don't make"status":"ok"your page-worthy keyword, or a Redis-only blip will be treated like a database outage. - Monitor one or two read-only business endpoints. A known product or order, or a
/v1/statusresource, with a check for an expected field or value. This proves the full path (routing, auth, database, serialisation) works, whichSELECT 1on its own can't. - Use a stable, known record. Pick something that won't change when real data does, such as a seeded test order. Otherwise you'll get false alarms the first time someone edits a product.
- Check for content that should not appear. Words like
error,maintenanceorexceptionshowing up in a 200 response are a red flag worth alerting on.
Most monitoring tools, Moonitor included, support keyword checks like this. You set the string you expect, and the monitor alerts when it's missing, or when an unwanted one appears. If your tool only does simple keyword matching, the two-monitor approach above is how you keep "degraded" from becoming a page.
One honest limit: content checks confirm shape and key values, not the full contract. Whether every field has the right type, or an edge-case response matches your OpenAPI spec, belongs in contract tests in your CI pipeline. Monitoring tells you production is healthy; CI tells you the code is correct. You want both.
What timeout should I set for REST API monitoring?
"What timeout should I set?" is probably the question I get asked most, and the honest answer is: it depends on your measured baseline and on how long your users will realistically wait, not on a number someone plucked from a blog post (including this one).
Timeout versus latency threshold
They sound similar but do different jobs:
- A hard timeout is where the monitor gives up. The request is recorded as failed.
- A latency threshold flags a request that succeeded but was slower than you'd consider healthy. That's a warning, not a page.
A method that works
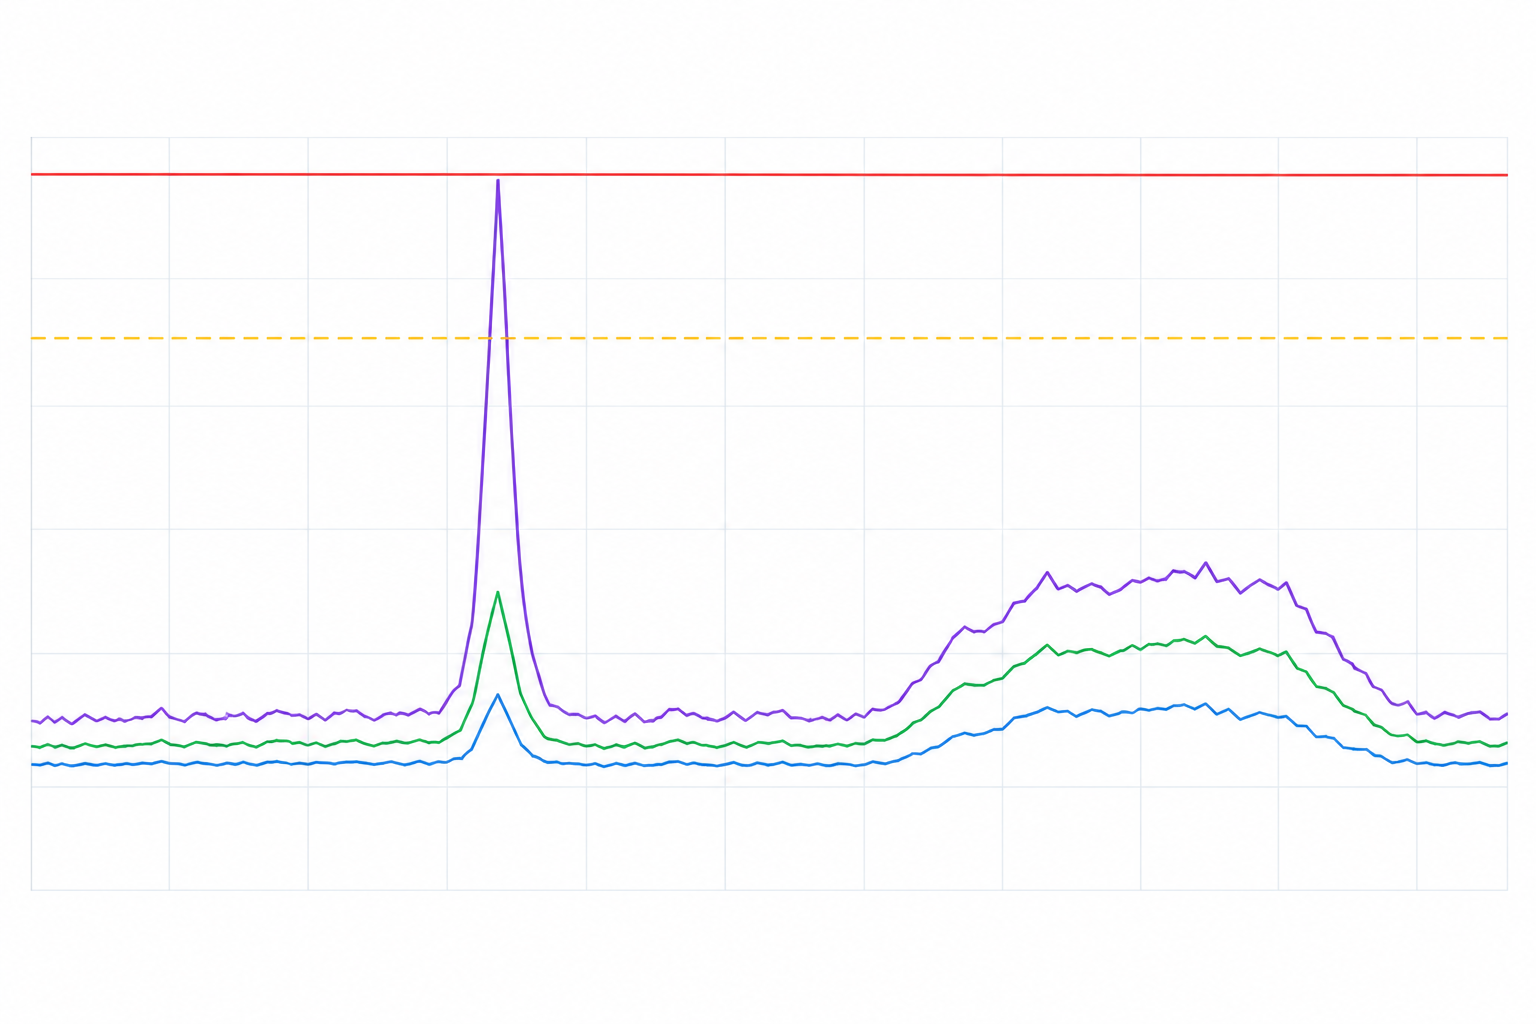
Averages hide pain. Google's SRE guidance is to look at tail percentiles such as p95 and p99, because an average can conceal slow requests that affect a real share of users. So:
- Collect response-time data over a couple of weeks, covering normal traffic, quiet periods and busy ones. Response-time analytics in your monitoring tool make this painless.
- Note your p95 and p99 for each endpoint.
- Set the warning threshold comfortably above p95.
- Set the hard timeout near what a real user, or a calling service, would tolerate before giving up.
AWS describes a similar idea in its Builders' Library: choose a tolerance for false timeouts, then use the matching latency percentile as a starting point. Their example is that if a 0.1% false-timeout rate is acceptable, the p99.9 latency is a sensible place to begin. That 0.1% is an illustration, not a universal answer, so pick a tolerance based on how much user impact you can live with.
Also, set limits per endpoint rather than one number for everything. A quick read, a search and a report generator have very different normal profiles.
Illustrative starting points
These figures are examples to give you a rough shape, not recommended defaults. Your hosting, database size, traffic and users' expectations will all move them, so replace them with your own numbers as soon as you have data.
| Endpoint type | Example baseline (p95) | Example warning threshold | Example timeout |
|---|---|---|---|
| Health endpoint | 50–150 ms | 500 ms | 5 s |
| Simple read (e.g. get order by ID) | 100–300 ms | 800 ms | 10 s |
| Heavy report or search | 1–3 s | 5 s | Depends on what users tolerate |
For that last row, I've deliberately left the timeout open. If a report can legitimately take half a minute, ask whether you should be monitoring it with a synchronous request at all, or whether a lighter check on the endpoint that kicks it off would tell you more.
Two more things worth knowing
First, keep your monitor's timeout longer than your internal database timeout. If your health endpoint gives the database 1.5 seconds, but your monitor gives up after one, you'll record a generic timeout instead of a clear "database: down" response. Let the endpoint tell you the real cause. This follows a broader principle too: a request's timeout should sit inside the caller's overall deadline, leaving room to handle the result. gRPC's documentation on deadlines makes the same point for service-to-service calls.
Second, think about geography. If most of your customers are in the UK, make sure at least one probe checks from London or a nearby European region, alongside others further afield. A response that's snappy from Frankfurt but sluggish from London tells you something a single far-off probe never will, and it's the London number your UK customers actually feel.
Is it safe to put API keys in a monitoring tool?
Is it safe to put API keys in a monitor? Yes, provided you treat the credential like any other secret. Here's what that looks like in practice.
- Create a dedicated, read-only, low-privilege key just for monitoring. Never reuse an admin token because it was handy.
- Prefer an unauthenticated
/healthendpoint for basic checks, and use authenticated checks only where you genuinely need to verify that auth works. - Send credentials in headers (
AuthorizationorX-API-Key), never in the URL query string, where they end up in access logs and browser history. - Rotate keys on a schedule, and revoke them immediately if a teammate leaves or the key is exposed.
- Restrict the key by scope and, where possible, by IP allowlist or rate limit.
- Check how your monitoring tool stores secrets. Header values shouldn't appear on public status pages or in exports.
- Test the negative case. Add a check that a request without credentials returns
401. It's a surprisingly good way to catch an endpoint that was accidentally left open.
How to avoid alert noise from slow API responses
How do you avoid alert noise from slow responses? Start by accepting that single slow requests are normal. Cold starts, garbage collection pauses and network jitter all produce the odd outlier, and none of them deserve a 3 a.m. phone call.
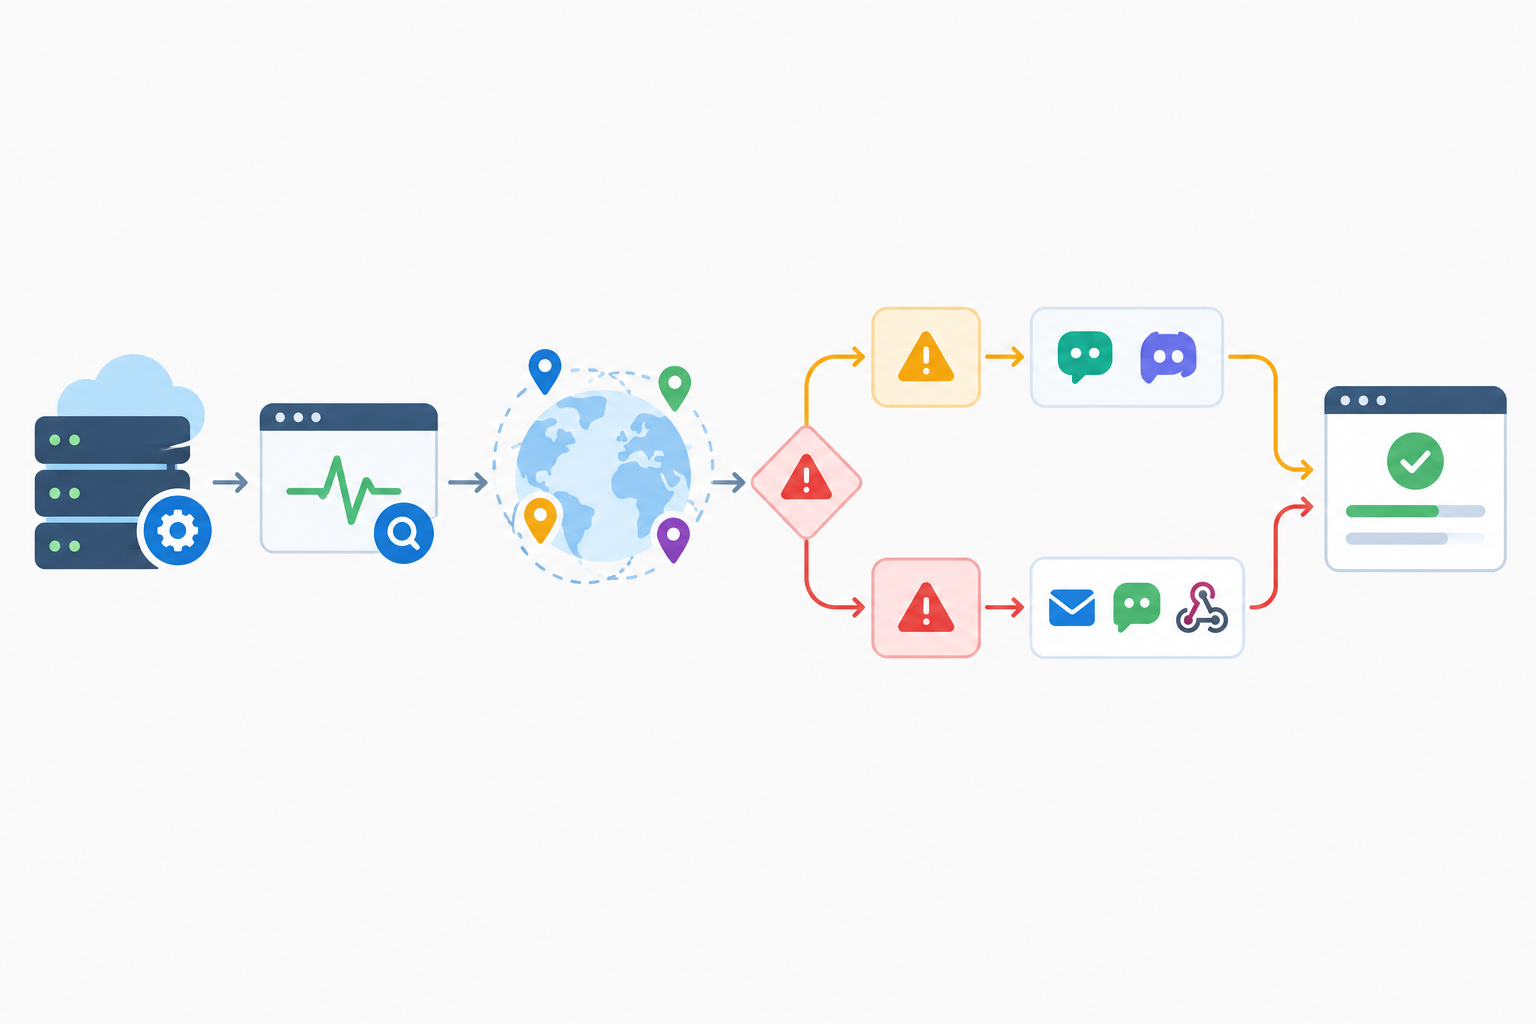
The biggest single help is confirming from more than one location. With multi-region failure verification, an alert only fires when the problem is seen from several places, not one flaky route, and that alone removes a huge share of false alarms. Pair it with a rule that needs two or three consecutive failures, because that's a very different signal from a single one.
Then separate warnings from pages. A breached latency threshold should nudge you in Slack or Discord, while hard failures go to on-call via email, Telegram or a webhook. Finally, review your alert history monthly. If a threshold fires constantly, it's either set wrongly or pointing at a real problem you've been ignoring, and either way it's worth acting on.
Here's a composite story, drawn from patterns I've seen across teams. Imagine a #alerts channel that pings dozens of times a day, mostly slow-response blips from a single region. Over a few weeks everyone mutes it, quite reasonably. Then a real database failover happens, the alert lands in the same ignored channel, and customers notice before the team does. The monitoring worked perfectly. The noise is what broke it.
How to connect API monitoring failures to alerts and a status page
Let's connect the pieces. I'll use Moonitor for the examples, but the same structure works in most monitoring tools.
Step 1: Create the critical health monitor
Add an HTTP/S monitor for /health. Set the expected status (200), a keyword check for "database":"up", your timeout and a check interval. Many teams start somewhere between one and five minutes for a critical API, but the right interval depends on how quickly you need to know, how much load the check adds, and how your confirmation rules are set up. Route failures from this monitor to on-call, after multi-region confirmation.
Step 2: Add a degraded-state warning
Create a second monitor on the same endpoint that looks for "cache":"up", and send its alerts to a team channel only. Now a Redis outage tells you "we're slower than usual" without paging anyone. (If the database goes down, this monitor will fail too, since the endpoint returns 503. That's fine, because the critical monitor is the one that pages.)
Step 3: Add a business endpoint monitor
Create a monitor for a key read-only endpoint, like your known test order, with content validation for an expected field or value. This is your check that the real customer path works, not just the plumbing.
Step 4: Connect a branded public status page
A status page lets customers see what's happening without flooding your support inbox. It's also a calm thing to point to while you're fixing the problem.
Step 5: Review incidents
After each failure, use the incident history for a short review. Did the health check catch it quickly? Was the alert routed correctly? Would a different keyword have caught it sooner? Refine as you go.
Step 6: Add the supporting monitors
Your API doesn't live alone, so cover what surrounds it:
- SSL certificate monitoring, so an expired certificate never takes you offline.
- DNS monitoring, to detect unexpected record changes.
- Heartbeat monitoring (cron job monitoring) for scheduled jobs and background workers that feed the API, such as the nightly sync that populates your orders.
If you'd like to try this, Moonitor has a 7-day free trial with no credit card, so you can point it at a staging health endpoint and see how it behaves before committing to anything.
REST API monitoring checklist
- ✅ Health endpoint exercises the database and returns 503 on critical failure
- ✅ Client-level timeouts are set, so hung checks don't pile up
- ✅ Critical failures and degraded states are monitored and routed separately
- ✅ A business endpoint check covers what
SELECT 1can't - ✅ Timeout and latency thresholds are based on your own measured p95 and p99
- ✅ Dedicated, read-only credentials stored securely
- ✅ Failures confirmed from multiple regions, including one near your users
- ✅ Supporting monitors for SSL, DNS and scheduled jobs
You don't need to do all of it today. Start with the health endpoint and a keyword check, which is where the biggest gains are, and add the rest as you go.
FAQ
Should my health endpoint be public?
It can be, as long as it only returns minimal information such as an overall status. Keep version numbers, hostnames and detailed error messages out of public responses. If you need richer detail, put it behind an authenticated endpoint and use a simple public one for external checks.
How often should I check my API?
There's no single right answer. Many teams check critical APIs every one to five minutes, but the best interval depends on how quickly you need to know about a failure, how expensive the check is, and how many regions are probing. Shorter intervals detect outages sooner but add load and the chance of noise, so pair them with multi-region verification and consecutive-failure rules.
Is a 200 status code ever enough?
For a static site or a simple availability check, it can be a reasonable starting point. For an API that depends on a database or other services, it only tells you the web layer responded, so add content validation and a dependency-aware health endpoint.
What's the difference between a latency threshold and a timeout?
A timeout is the point where the monitor gives up and records a failure. A latency threshold flags a response that succeeded but was slower than you consider healthy, which makes it better suited to a warning than an urgent page.