
Scaling Your Monitoring Strategy Across Hundreds of Sites: A Guide for Agencies
Scale your monitoring strategy across hundreds of client sites with smarter organisation, alert management, API automation and clear agency reporting now
Scaling Monitoring Strategy: How Agencies Manage Monitoring Across Hundreds of Client Sites
A practical guide for agencies and growing teams on scaling a monitoring strategy across dozens of client sites—covering monitor organisation, alert management, API automation, and client reporting.
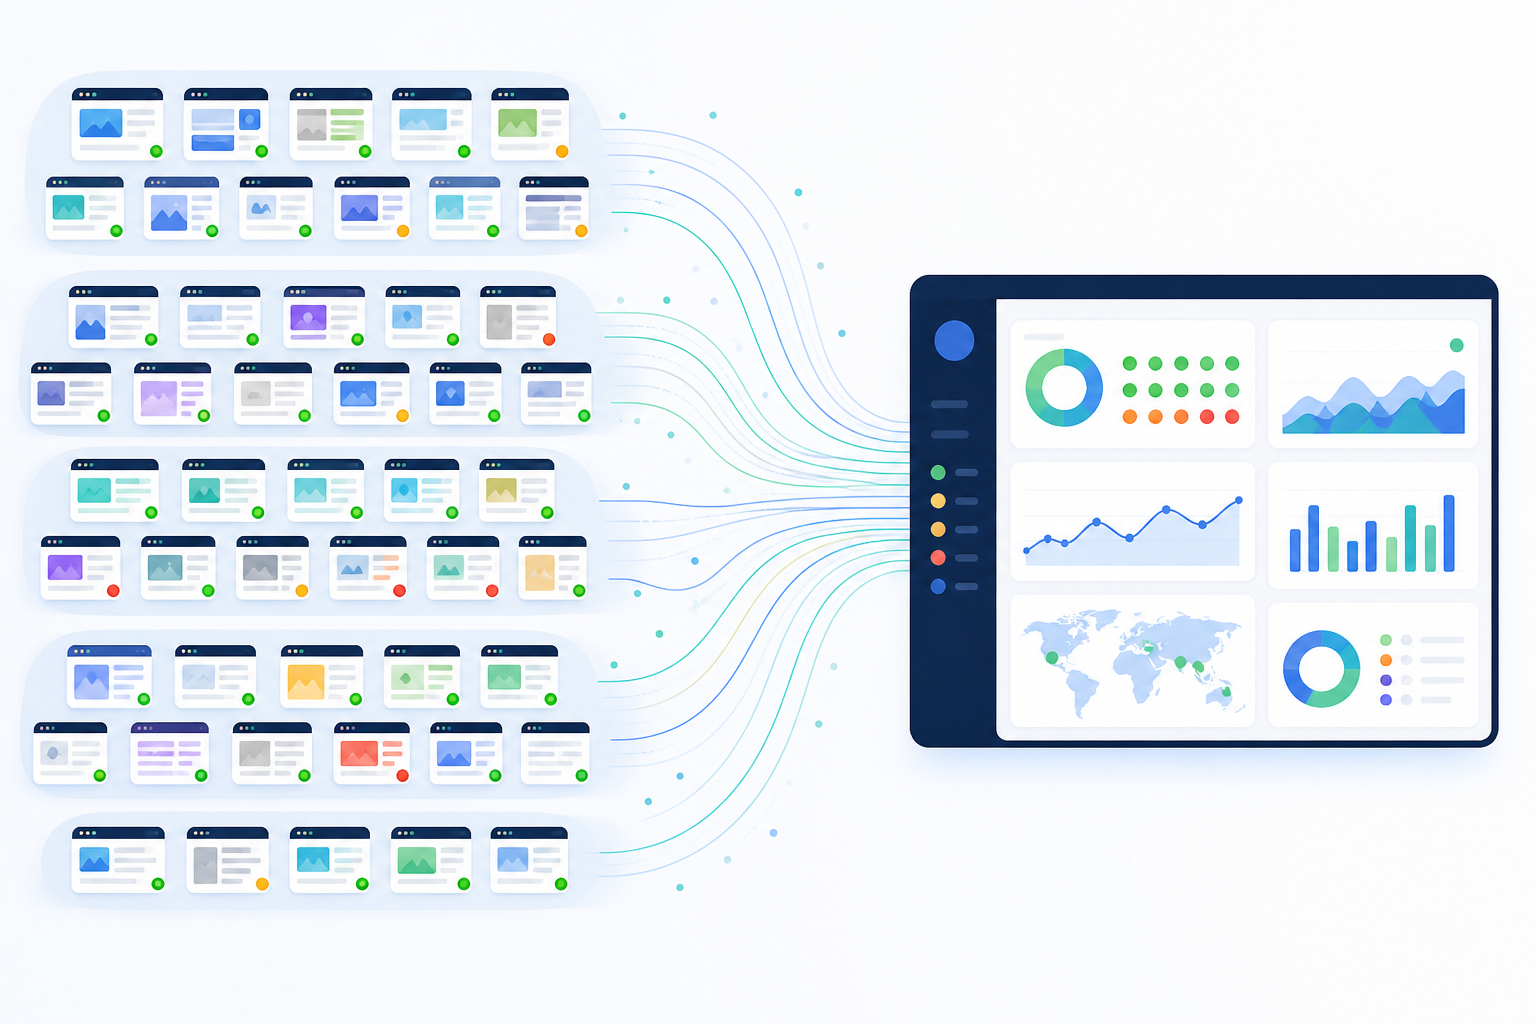
If you're managing monitoring for one client site, almost any setup works. Click a button, create a monitor, and get an email when the site goes down. Simple.
But somewhere between client number 10 and client number 50, that simple system starts to creak. You've probably felt it already—the dashboard that used to take a glance now takes ten minutes to scroll through, the Slack channel that used to be useful is now background noise, and onboarding a new client means an hour of repetitive clicking instead of five minutes of setup.
Here's the thing nobody tells you when you start out: scaling monitoring strategy across multiple client sites isn't about adding more monitors. It's about changing how you organise, alert, and report on them. Agencies that scale smoothly tend to do three things well: they group monitors by client and service, automate monitor creation via API instead of clicking through a dashboard, and build alerting rules that route noise away from humans until it actually matters. Get those three things right, and going from 20 sites to 200 stops feeling like a crisis and starts feeling manageable.
To make this concrete, imagine a hypothetical agency—we'll call them Northside Digital—growing from 20 client sites to 200 over eighteen months. At 20 sites, one person managed monitoring as a side task. By 150 sites, that same flat structure meant a two-hour onboarding process, a Slack channel nobody trusted, and a client call that took forty minutes because nobody could find the right monitor. We'll come back to Northside throughout this guide to show what changes at each stage.
Let's walk through what that actually looks like in practice.
Signs You've Outgrown Your Current Monitoring Setup
Before getting into solutions, it's worth checking whether this is actually your problem right now. Some agency teams assume they just need “better discipline” when they have really outgrown their tooling. If two or more of these signs sound familiar, it's time to rethink your monitoring structure—not just add more monitors to the pile:
- Onboarding a new client site takes longer than 10–15 minutes. If setting up HTTP checks, SSL monitoring, and API endpoints means repeating the same clicks every time, that's a process ready to be automated.
- Fewer than half your team's alerts get acknowledged within five minutes. When the noise-to-signal ratio gets bad enough, people start scrolling past alerts on autopilot. That's exactly when a real incident slips through.
- You can't answer “is Client X's website or API working?” in under a minute. If a client calls and you have to hunt through dozens of unrelated monitors, your structure isn't working for you.
- Reporting means screenshotting dashboards or building spreadsheets by hand. This scales linearly with your client count—which is exactly the cost you want to avoid as you grow.
- More than 10% of your monitors have no clear owner or documented purpose. Undocumented monitors are usually the first casualty of rapid growth, and they're the hardest thing to clean up later.
- Your on-call person can't tell if a 3am alert is a real outage or a flaky check. This is the most dangerous symptom because it means trust in the monitoring system has already broken down.
How to Organise Monitoring Across Multiple Client Sites
Here's something that trips up a lot of growing teams: a flat list of monitors works fine right up until it doesn't. Somewhere around 20 to 30 sites, that undifferentiated list becomes genuinely unmanageable. You can't scan it quickly, filter it meaningfully, or hand it off to a new team member and expect them to understand it.
The fix is deceptively simple: structure your monitors the way you'd structure your client relationships. A naming and tagging convention that works well in practice looks like this:
client-environment-service-monitortype
For example:
acme-prod-web-http(production website check)acme-prod-api-endpoint(production API monitoring)acme-prod-web-ssl(SSL certificate monitoring)acme-staging-web-http(staging environment check)acme-prod-server-cpu(server resource monitoring, if you're monitoring infrastructure as well as sites)
A monitor named acme-prod-api-endpoint is instantly more useful than one called “API Check 14”. If you're supporting server monitoring alongside website and API checks—such as CPU, memory, disk usage, and cron jobs—the same convention extends cleanly to infrastructure.
This matters for more than tidiness. When you structure monitoring by client, handoffs become painless: a new team member can see everything related to one account without digging. Offboarding gets cleaner too, because you know exactly which monitors to retire when a client leaves. Billing reconciliation, which is usually a headache when monitoring is tangled across clients, becomes a matter of filtering by tag.
Group Monitors by Client, Environment and Service
Within each client group, it also helps to separate monitors by type: website monitoring, API monitoring, SSL certificate monitoring, DNS monitoring, cron job monitoring, and server resource monitoring where relevant. This isn't just organisational neatness—it surfaces patterns you might otherwise miss. Once monitors are grouped this way, it isn't unusual for a pattern to emerge that was invisible in a flat list. For instance, one client's SSL certificates might lapse every quarter because a DevOps team isn't rotating certificates properly. Grouped monitoring makes that recurring issue obvious rather than burying it.
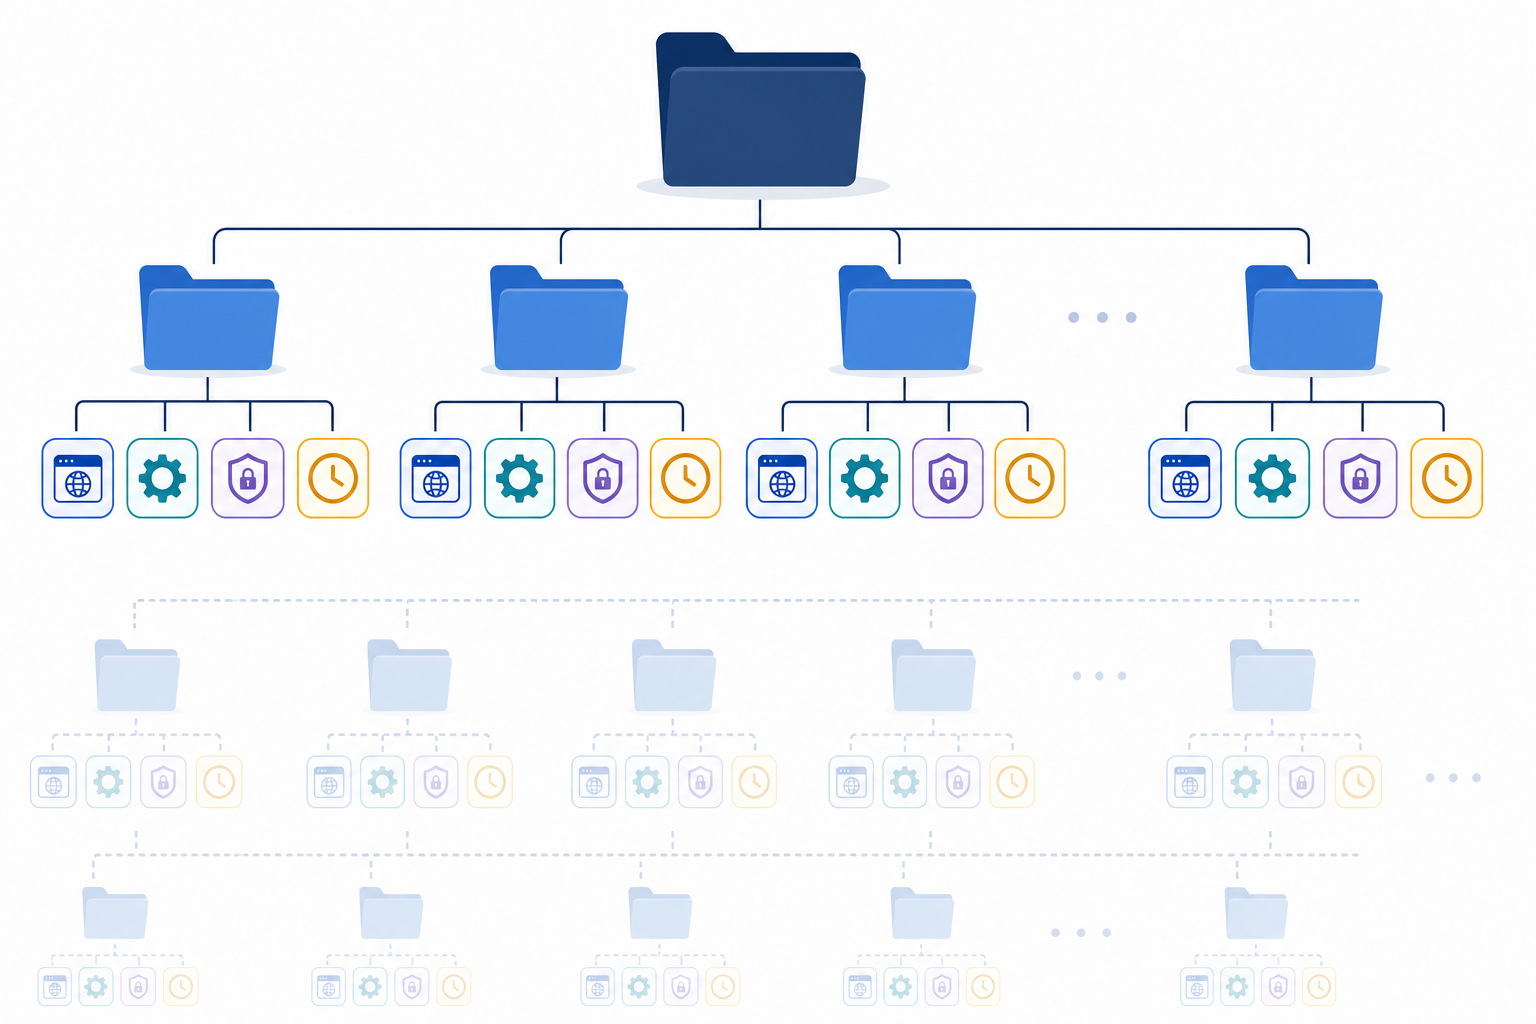
This exact structure also feeds your status pages and client reporting. If your monitors are already grouped by client and service, generating a per-client status page or monthly report becomes a filtering exercise rather than a manual reconstruction project.
For Northside Digital, retagging 150 monitors with this convention took about a day and a half—tedious, but it cut their onboarding time from two hours to fifteen minutes almost immediately because the process was now repeatable.
How to Manage Alert Noise as Monitoring Scales
It's worth being precise here: more monitors don't automatically mean more false positives—they mean more alert volume. Whether that volume includes a high proportion of false positives depends on your thresholds, failure-verification approach, and the quality of the checks themselves. Conflating the two can lead teams to choose the wrong fix. If your false-positive rate is high, the problem is usually threshold tuning or check design, not simply the number of monitors you're running.
A few things make a genuine difference when managing alert noise at scale:
- Define an explicit failure condition before you scale alerting. A reasonable starting point is two failed checks from two different regions within a five-minute window before an alert fires. Multi-region verification reduces false alarms caused by a single network blip, but it isn't free—it adds a small amount of latency to detection and, depending on your platform, may cost more per monitor. Weigh that trade-off against how disruptive false alarms are for your team.
- Build a tiered escalation policy with defined timings, rather than routing everything to the same place. A workable model for production-critical services is to notify a low-friction channel such as Slack or Microsoft Teams immediately after the first verified failure; open an incident automatically if it is still failing after five minutes; and page the on-call person by SMS or phone if it remains unresolved after ten minutes. Slack is useful for triage, but it isn't a substitute for proper paging on anything genuinely production-critical.
- Group alerts by client so whoever is on call can instantly see which account is affected without decoding a monitor name at 3am. This is where the naming and tagging structure from earlier pays for itself.
- Use maintenance windows for expected downtime. Deploys, scheduled maintenance, and planned server restarts shouldn't trigger incident alerting. If your team has to mute alerts manually every time this happens, you're one forgotten mute away from an unnecessary escalation.
- Review alert history monthly. Chronically noisy monitors are almost always fixable—perhaps because of incorrect thresholds, an overly sensitive check, or a genuinely unstable server that needs attention rather than repeated alerts. A monthly review catches these issues before they train your team to ignore alerts.
If you're in the UK and running a distributed or partly remote on-call rota, separate business-hours escalation from out-of-hours escalation explicitly. A client's marketing site going down at 2pm on a Tuesday probably warrants a different response speed from the same incident at 2am on a bank holiday.
The underlying goal is the same: keep alert volume low and false-positive rates lower, so that when something does fire, people believe it and act on it.
Using APIs to Automate Monitor Creation
Once your structure is solid, the next lever is automation—specifically, getting monitor creation out of the dashboard and into your onboarding process. Clicking through a user interface for every new client is fine when you're onboarding one client a month. It's a genuine bottleneck when you're onboarding several a week.
Build a Repeatable Monitoring Bundle for Every Client
Here's how to approach building this out:
- Map your standard monitor bundle for a typical client. Most agencies have a predictable pattern—perhaps an HTTP check on the main site, SSL certificate monitoring, DNS monitoring, and one or two API endpoints. Write that bundle down explicitly.
- Use the monitoring platform's API to create that bundle automatically. A short script can call the API once and spin up the entire bundle when a new client signs on. A simplified example payload might look like this:
{
 "client": "acme",
 "environment": "prod",
 "monitors": [
 {"type": "http", "url": "https://acme.com", "tag": "acme-prod-web-http"},
 {"type": "ssl", "url": "https://acme.com", "tag": "acme-prod-web-ssl"},
 {"type": "api", "url": "https://api.acme.com/health", "tag": "acme-prod-api-endpoint"}
 ]
}
- Build in idempotency and error handling. If the script fails partway through—say, the HTTP monitor is created but the API call for SSL monitoring times out—it should be safe to rerun without creating duplicates, and it should log clearly which parts of the bundle succeeded. A common approach is to check for an existing tag before creating a monitor, and to fail the whole bundle loudly rather than leaving a client half-monitored silently.
- Tie monitor creation into your existing onboarding scripts or provisioning workflow. If you already have a process for setting up hosting, DNS, or a staging environment for new clients, connect monitor creation to that same pipeline so it's never a separate step someone forgets.
- Use tags or metadata via the API so new monitors are grouped correctly as soon as they're created—without a manual tagging step.
- Build a decommissioning step into offboarding. This is often overlooked. When a client leaves, their monitors should be archived or removed as part of the standard offboarding checklist, not discovered six months later when someone notices you're still paying for—and alerting on—an account that has churned.
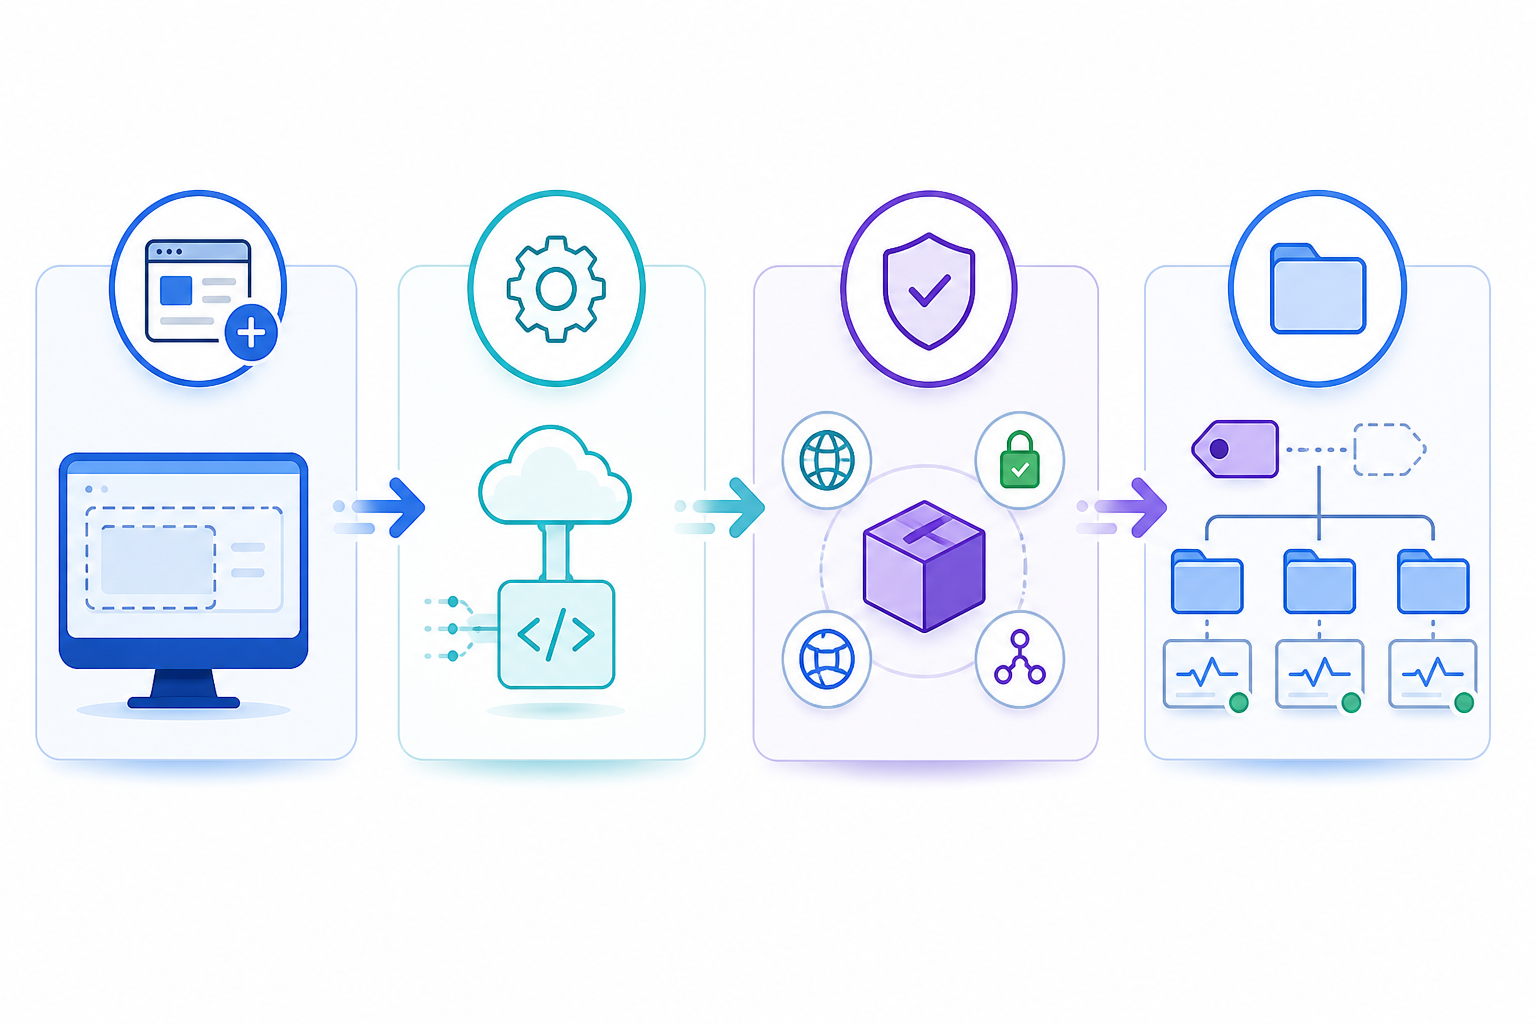
This is why full API access and data export matter when choosing a monitoring platform—not as nice-to-have features, but as capabilities that determine whether your onboarding scales or becomes a growing time sink. Whichever platform you use, check the API documentation for rate limits and bulk-creation endpoints before building against it. Some platforms handle a 50-monitor bundle in one call; others require one call per monitor.
Reporting Monitoring Performance Across Multiple Clients
Clients generally don't want a raw dashboard. They want reassurance—a clear, simple answer to “is everything okay?” without needing to interpret graphs or understand what a 500 error means.
Use Branded Status Pages and Historical Monitoring Data
Branded public status pages solve this cleanly. Instead of manually screenshotting uptime charts or explaining an incident over email, you can point clients to a status page that reflects their brand and shows exactly what is relevant to them.
Response-time analytics and incident history serve a slightly different purpose: they give you an evidence trail. When a client asks whether you're meeting the SLA you promised, historical uptime and incident data turns that conversation from a guessing game into a short, evidence-backed discussion—provided the numbers are presented honestly.
A few things matter for that honesty. First, decide upfront how you'll treat planned maintenance. If a deploy causes five minutes of downtime inside an agreed maintenance window, it shouldn't count against uptime, but it needs to be clearly labelled as excluded rather than quietly omitted. Second, distinguish planned from unplanned downtime explicitly in the report itself. A client should be able to see both figures, not just the more flattering one.
A simple monthly monitoring report template covers:
| Metric | Example |
|---|---|
| Uptime (excluding planned maintenance) | 99.94% |
| Uptime (including planned maintenance) | 99.81% |
| Incidents (unplanned) | 2 |
| Total downtime (unplanned) | 18 minutes |
| Average response time (95th percentile) | 340ms |
| SLA target met? | Yes (target: 99.9%) |
Once your monitors are grouped by client, pulling these numbers for a specific account is a filtering exercise, not a research project. If a status page isn't flexible enough for your needs, use data export or the full API to pull metrics into your own reporting tool. This gives you complete control over formatting and is useful if you're building white-labelled reports as part of a broader client relationship.
Choosing a Monitoring Plan That Scales With Your Agency
Here's something that catches many growing agencies off guard: per-monitor pricing feels reasonable at first, then quietly becomes expensive as your client roster grows. What starts as a few pounds per monitor can turn into a significant line item once you're managing hundreds of checks across dozens of clients. Worse, it can create a perverse incentive to under-monitor clients just to control costs.
When evaluating a monitoring platform for agency use, a few capabilities matter more than the sticker price:
- Unlimited or generously scaled monitor limits, so growth doesn't mean renegotiating your plan every few months.
- Full API access, so you can automate onboarding and offboarding rather than doing it by hand.
- Multi-region verification, so false alarms from a single region don't page your team unnecessarily. As noted earlier, weigh this against added latency and cost.
- Data export, so you're never locked into one platform if your needs change.
- Branded status pages, so clients can view relevant service information without seeing unrelated accounts.
Here's how that looks in practice, using Moonitor's published plans as one example. Figures were correct at the time of writing, exclude VAT, and should be checked against the provider's current pricing page before committing:
| Plan | Monitors | Full API | Multi-region checks | Branded status pages | Data export | Price/month (excl. VAT) |
|---|---|---|---|---|---|---|
| Solo | 20 | Yes | Yes | Yes | Yes | £14 |
| Growth | 75 | Yes | Yes | Yes | Yes | £29 |
| Max | Unlimited | Yes | Yes | Yes | Yes | £49 |
The detail worth noting isn't just the price—it's that API access, multi-region checks, status pages, and data export are included on every tier rather than gated behind the most expensive plan. That matters specifically for agencies because it means you can build your automation and tagging structure on the cheapest plan and scale up for monitor volume, rather than to unlock features you need on day one.
Whichever platform you're evaluating, it's worth testing before committing. Most monitoring platforms, including Moonitor, offer a free trial. Use it to set up your tagging structure, try API-based monitor creation, and see whether the organisational approach fits how your agency works before committing to a paid plan.
A Scaling Monitoring Strategy Checklist Before You Scale
If you're about to grow beyond 30–50 client sites, check these off first:
- Naming and tagging convention agreed and documented (
client-environment-service-monitortype) - Monitor bundle mapped for a typical client
- API-based onboarding script built and tested, including error handling
- Escalation policy written down with specific timings, not left to individual judgement
- Maintenance windows configured for known deploy schedules
- Monthly alert-history review scheduled
- Offboarding checklist includes monitor decommissioning
- Reporting template defined, with planned and unplanned downtime clearly separated
Get these in place and the jump from 20 sites to 200 stops being a scramble. It becomes a repeatable process—which, honestly, is the whole point of a scalable monitoring strategy.
FAQ: Scaling Monitoring Across Client Sites
How do I manage monitoring for dozens of client sites without losing track of everything?
Start with structure, not tools. Use a consistent naming convention such as client-environment-service-monitortype, group monitors by client and service, and set up alert routing so noise doesn't drown out real incidents. For example, an agency managing 80 sites might tag every monitor with the client name and environment, then filter by tag to onboard, report, or troubleshoot in seconds rather than scrolling through hundreds of unrelated checks. Once that structure exists, adding the 50th client is roughly as manageable as adding the 5th.
What tools help organise monitors at scale?
Look for a monitoring platform with tagging or grouping features, a full API for automation, branded status pages for each client, and data export so you're never locked in. A useful test is to try creating and tagging ten monitors via the API in under five minutes. If that's not possible on your current platform, automation is likely to be harder than it needs to be. Moonitor is one platform that supports this across website, API, SSL, DNS, cron job, and server monitoring in one dashboard, although the underlying principles apply regardless of which tool you choose.
How do I keep alert noise manageable as monitors grow?
Separate alert volume from false-positive rate. More monitors mean more alerts, but not necessarily more noise if your checks and thresholds are well designed. Define an explicit failure condition—for example, two failed checks from two regions within five minutes—before escalating. Set tiered escalation timings so only persistent issues page a human, group alerts by client for faster triage, and schedule maintenance windows for expected downtime. Review alert history monthly to catch and fix chronically noisy monitors before they train your team to ignore alerts altogether.