
Uptime Monitoring vs APM: What's the Real Difference (and Which Do You Actually Need)?
Confused about uptime monitoring vs APM? We break down what each tool measures, when to use one, both, or neither, with a side-by-side comparison for
Uptime Monitoring vs APM: What's the Real Difference and Which Do You Need?
If you've ever stared at your monitoring budget and wondered whether you need uptime monitoring, APM, or both, here's the short answer: uptime monitoring tells you whether your service is reachable and behaving correctly from the outside, while APM (Application Performance Monitoring) tells you why it's slow or broken from the inside.
That's the useful mental model, though it's not a perfectly clean split. Uptime tools can catch more than simple downtime, and APM can flag availability and error-rate problems too. The real difference between uptime monitoring and APM is vantage point and diagnostic depth, not a strict divide between "is it up?" and "why is it broken?"
Most small-to-mid-sized teams start with uptime monitoring because it's affordable, takes minutes to set up, and catches the failures that actually wake people up at 3am: a server going dark, an SSL certificate quietly expiring, or a scheduled job that silently stopped running. APM tends to earn its place later, once you're debugging performance issues across services that all talk to each other in ways only your senior backend engineer fully understands.
But there's more to the full monitoring picture than these two categories. Let's break down what uptime monitoring and APM actually measure, where they overlap, and how to figure out what your team needs right now, not what a vendor's sales page wants you to think you need.
What Uptime Monitoring Actually Measures
Uptime monitoring is an outside-in check. It asks a question repeatedly, from various locations around the world: "Can I reach this thing, and is it behaving correctly?" What it covers depends on the specific product and how you've configured it, but here's the typical range:
- Availability checks: Is the website, API, or server responding at all? This includes HTTP/S checks, port checks, and basic ping monitoring to confirm something's alive on the other end.
- Response time from multiple regions: A single check from one location can be misleading if there's a local network issue. Multi-region checks, something we take seriously at Moonitor, help rule out false alarms before they page anyone.
- SSL certificate and domain expiration monitoring: Nothing ruins a Friday afternoon quite like a browser security warning telling users your website isn't safe.
- Cron job and heartbeat monitoring: Scheduled tasks fail silently more often than you might think. Heartbeat monitoring catches the backup job that quietly stopped running three weeks ago.
- DNS record change detection: Useful for catching unauthorised changes or an accidental typo in a DNS record that nobody notices until customers start complaining.
- Keyword and content monitoring: Confirms the page loaded the right content, not just any content.
- Synthetic transaction and browser checks: More advanced uptime monitoring tools can simulate a multi-step journey, like logging in and adding an item to a basket, rather than simply pinging a single URL.
That keyword monitoring point deserves a real example because it trips people up constantly. Imagine your checkout page returns a perfectly healthy 200 OK status code, but the page itself displays "Payment processing error, please try again." A basic ping or status check sees the 200 response and moves on happily, blind to the fact that nobody can actually buy anything.
Keyword monitoring checks that specific text appears (or doesn't appear) on the page, so it catches this kind of silent failure. This is the sort of gap that separates basic ping tools from comprehensive website and API monitoring setups.
What APM Tools Measure
APM lives inside your application, instrumented with agents or SDKs that trace what's actually happening as code executes. It's mostly an inside-out view, though a good APM tool can also alert you about availability and error rates, not just performance problems. APM typically digs into:
- Code-level tracing: Pinpointing exactly which function, database query, or microservice call is causing a slowdown.
- Database query performance: Including slow query logs that reveal which queries are quietly eating up your response times.
- Memory usage, garbage collection, and CPU profiling: The kind of detail that matters when your application is technically running but resource usage keeps creeping up.
- Distributed tracing across microservices: Following a single request as it moves between several services, so you can see exactly where it slowed down or failed.
- Error tracking tied to specific deployments: Connecting a spike in errors directly to the release or commit that introduced them.
One thing to know before you commit to an APM tool: the quality of the data depends heavily on how thoroughly you instrument your code. It also depends on decisions like sampling rate (how much trace data you keep versus discard) and retention period.
Full tracing on every request at high traffic volumes can get expensive fast and may add measurable overhead. Most teams sample their data instead, keeping, say, 10% of traces in detail while summarising the rest. That's a genuine trade-off, not a footnote, and it's worth understanding before you're surprised by a bill.
Here's the example that usually makes the difference between uptime monitoring and APM click. Your app is up, responding to requests, and passing every uptime check with flying colours. But a single database query, buried three layers deep in your checkout flow, is silently adding four seconds to every transaction.
Uptime monitoring has no way of seeing this. It registers a 200 response, maybe slightly slower than usual, but nothing that trips an alert. APM traces the problem to the exact line of code, query, and moment it started happening. That's the kind of visibility only APM can give you. There's no faking it from outside the app.
Uptime Monitoring vs APM: Key Differences and Use Cases
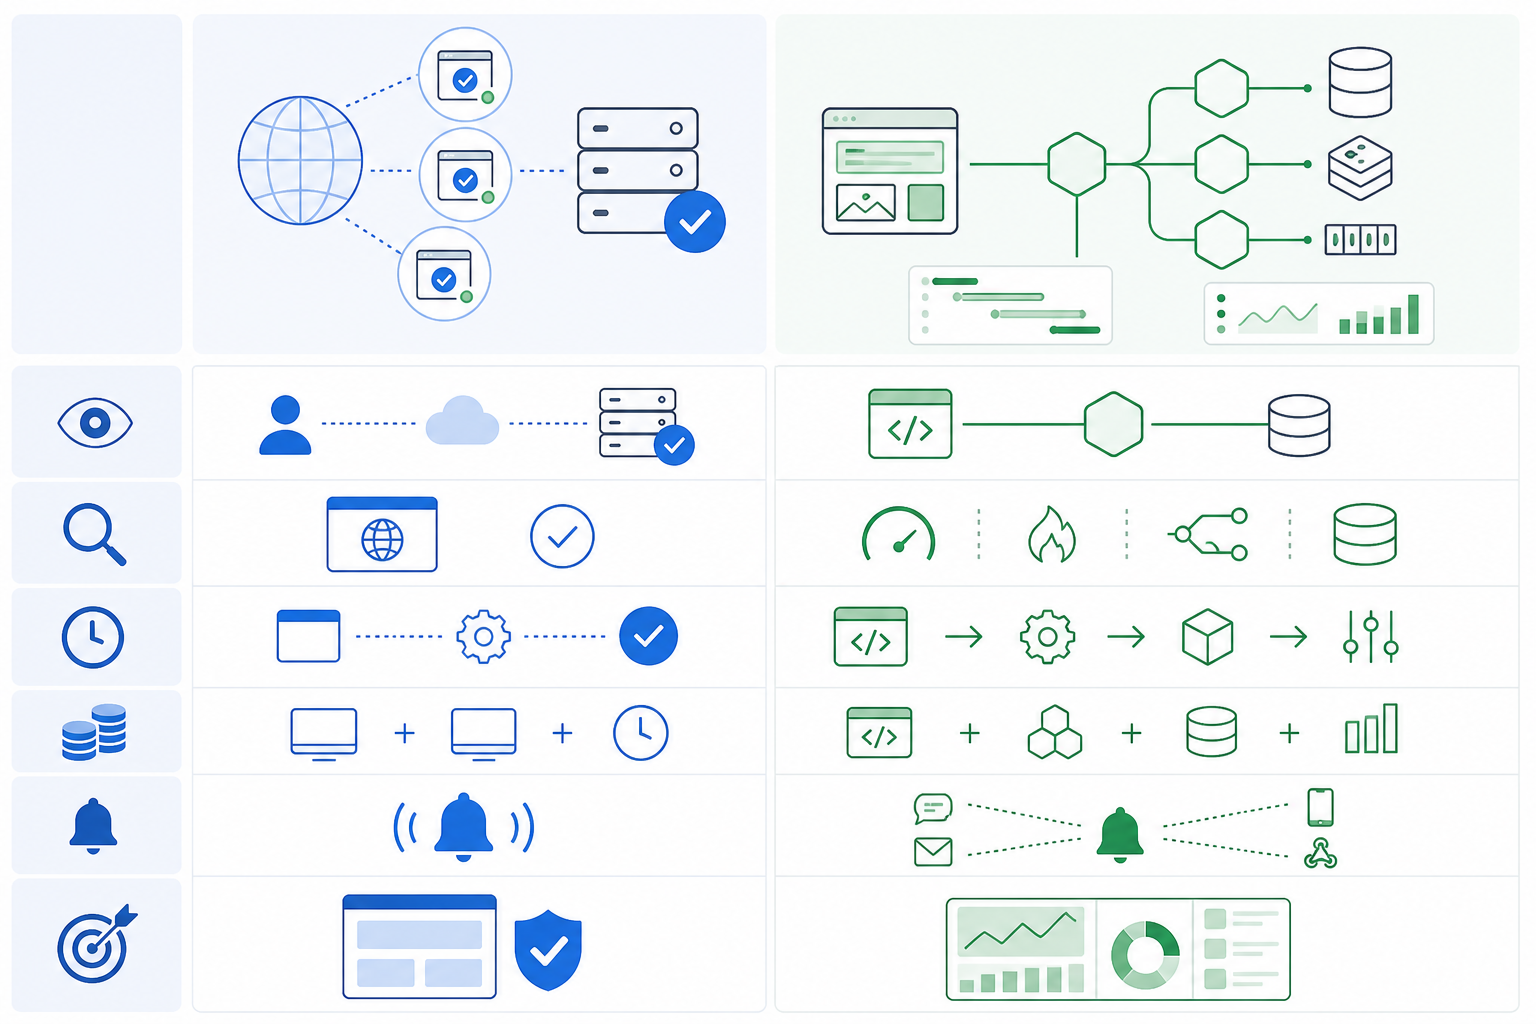
Seeing uptime monitoring and APM side by side makes the differences clearer than reading about them in isolation. Here's a quick reference before we look at some real-world scenarios.
| Uptime Monitoring | APM | |
|---|---|---|
| Vantage point | External, checking from multiple regions outside your infrastructure | Internal, using agents embedded inside your application |
| Primary question | "Is it reachable and correct?" | "Why is it slow or broken, and where?" |
| Setup time | Often under a minute, with no code changes needed | Usually requires SDK or agent installation, instrumentation, and sampling configuration |
| Typical cost drivers | Number of monitors, check frequency, and number of regions | Number of hosts, ingested trace or event volume, and retention period |
| Alerting style | Availability, latency, and content-based threshold alerts | Error-rate, latency, dependency, resource, and sometimes anomaly-based alerts |
| Best for | Public-facing availability, SLA tracking, and quickly catching outages and silent failures | Deep performance debugging across complex, multi-service backends |
| Data retention and lock-in | Look for full API access and data export | Apply the same principle, especially as trace volume grows |
On pricing, I'm deliberately not quoting fixed numbers because costs shift constantly and vary by provider, plan tier, and usage. What's worth understanding instead is what drives the cost. Uptime monitoring tools generally charge by monitor count, check frequency, and number of regions. APM tools generally charge by host count, event or trace volume, and data-retention period.
Ask any vendor to walk you through those cost drivers before you commit, rather than relying on a headline price.
Real-World Scenarios: Where Uptime Monitoring and APM Shine
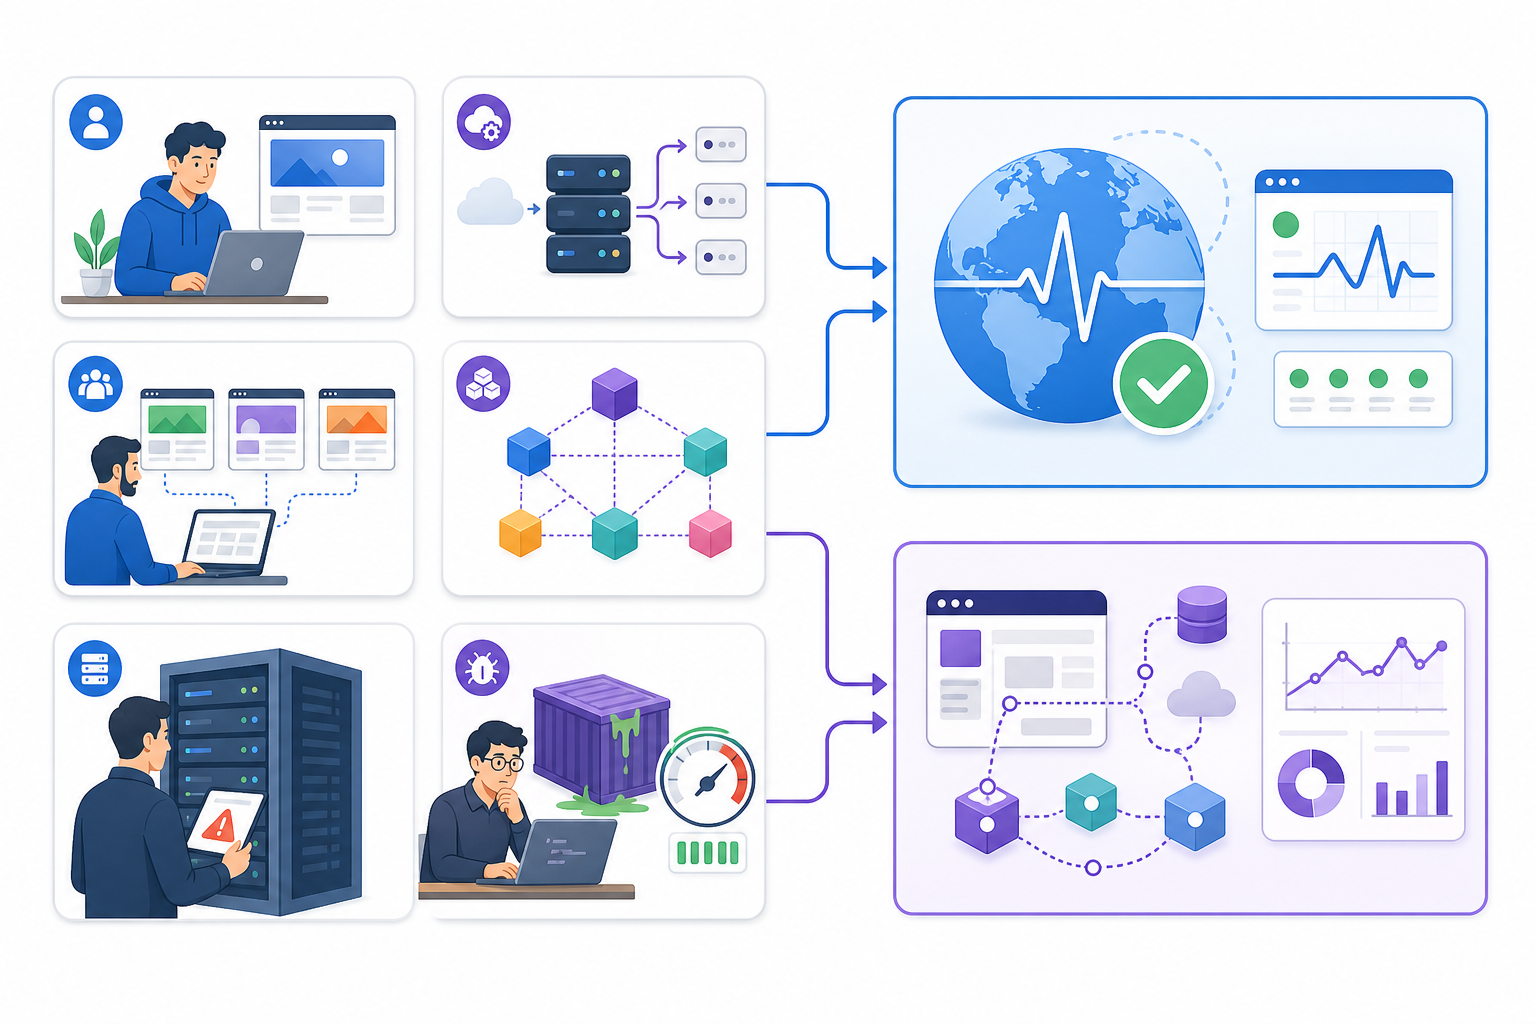
Scenario 1: The solo developer running a SaaS side project. One server, one database, and limited hours in the day. Uptime monitoring alone is usually enough here. It catches outages and SSL expiry without the setup overhead of APM. You want to know if something's broken, not spend an evening configuring distributed tracing.
Scenario 2: A small team running a customer-facing API with an SLA. Uptime monitoring handles the public promise ("we guarantee 99.9% availability") while response-time analytics help you spot creeping latency before customers start filing support tickets. You don't necessarily need code-level tracing yet, but you do need to watch the trend lines.
Scenario 3: A growing startup with microservices and vague "it's slow but not down" complaints. This is where APM earns its keep. When five services are involved in fulfilling one request and something intermittently adds latency, external checks can't tell you where the problem lives. Distributed tracing can.
Scenario 4: An agency managing dozens of client websites. Nobody wants to instrument thirty different client codebases with APM agents. Uptime monitoring with branded public status pages builds client trust and gives clients visibility into incidents without touching a line of their code.
Scenario 5: A team chasing a memory leak that only shows up after 12 hours of uptime. Every uptime check comes back green, right up until the server falls over. APM's profiling tools catch the slow creep in memory usage that uptime checks were never built to see, since from the outside, nothing looks wrong until it suddenly is.
Scenario 6: A team whose app is fast in testing but slow for real users on mobile connections, or whose Kubernetes pods keep getting OOM-killed under load. Worth flagging honestly: neither uptime monitoring nor APM alone solves this cleanly. You may need real-user monitoring (RUM) to see what actual visitors experience across devices and networks, or infrastructure monitoring to watch container memory, CPU throttling, and node health directly.
Uptime monitoring and APM are two common starting categories, but they're part of a wider observability toolkit that can also include logs, error tracking, infrastructure metrics, RUM, and synthetic browser monitoring.
A Practical Uptime Monitoring vs APM Decision Guide
- Simple app, one team, and low-stakes downtime → Uptime monitoring is enough to start.
- Customer-facing SLA or compliance requirement → Uptime monitoring is non-negotiable, regardless of what else you add.
- Multiple services, recurring "slow but not down" complaints, or a dedicated backend team → Add APM.
- Resource exhaustion, container crashes, or infrastructure-level flakiness → Consider infrastructure monitoring alongside uptime checks.
- Complaints about real-world user experience that don't show up in your own testing → Consider RUM or synthetic browser journeys.
When You Need Both Uptime Monitoring and APM
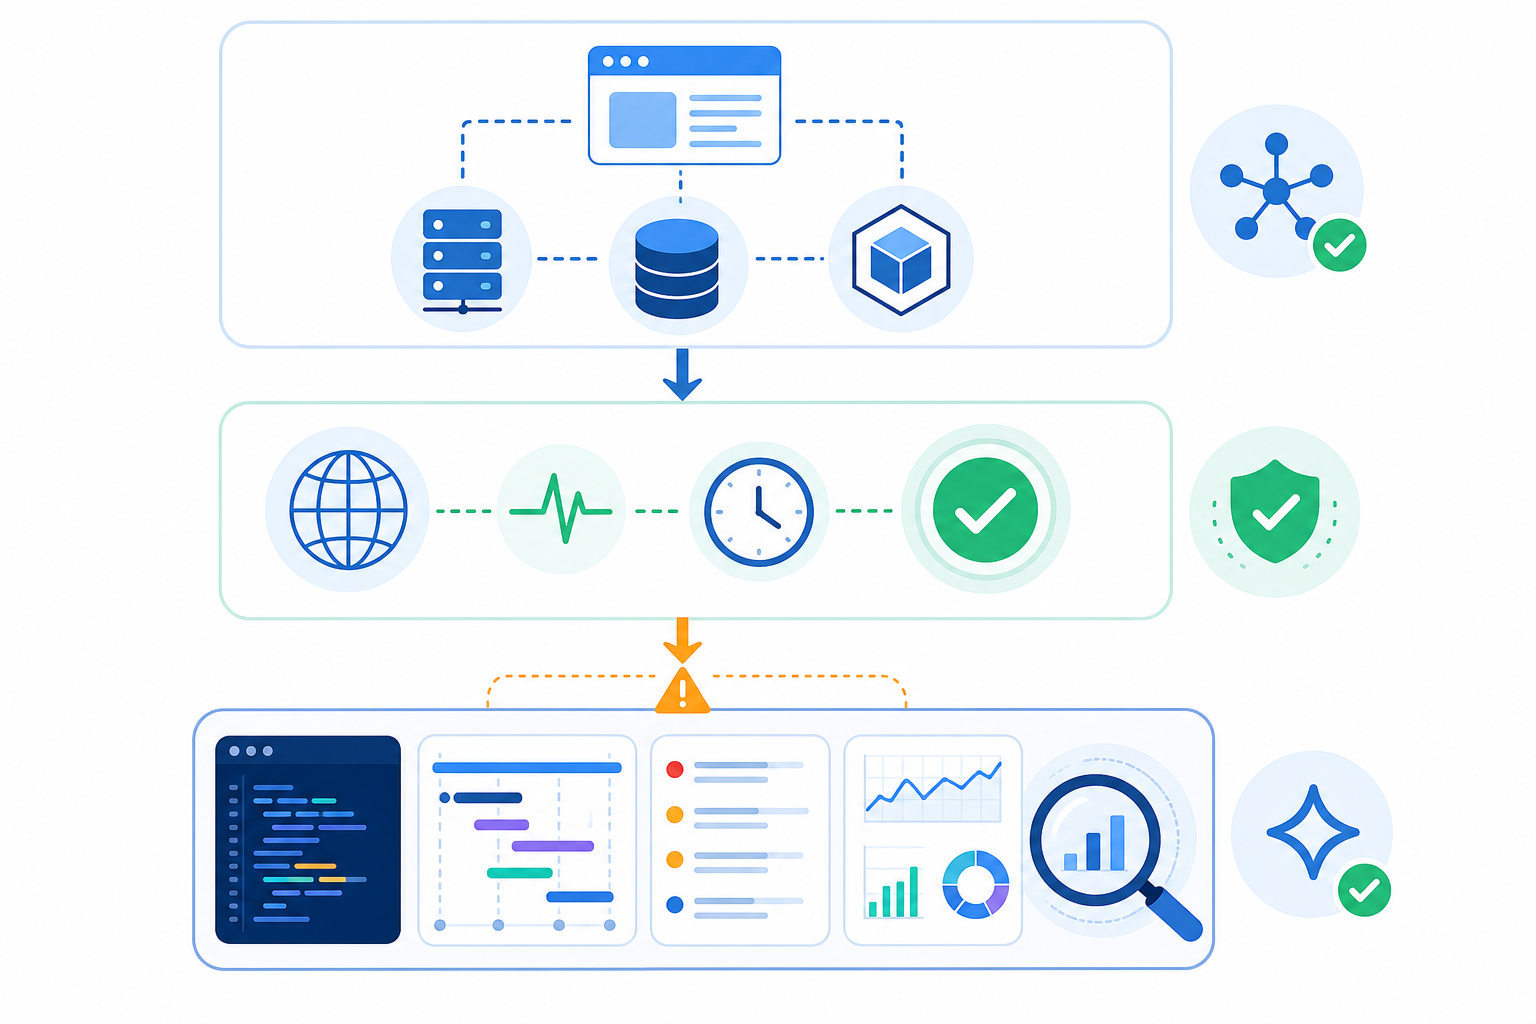
Once your infrastructure matures, this stops being an either/or decision. Think of uptime monitoring as the outer alarm system (the smoke detector that goes off the moment something is visibly wrong) and APM as the internal diagnostic tool you use to find the source.
Adding APM doesn't remove the need for uptime monitoring, though. They answer different questions, and you generally want both once the stakes are high enough.
A realistic incident often unfolds like this: an uptime alert fires first because an API's response times have spiked or a specific endpoint has started returning 500 errors. That tells you something is wrong quickly, often within seconds. Your team then turns to APM traces to pinpoint the internal root cause. Maybe a recent deployment introduced a database migration that locks a table under load.
APM isn't only reactive, either. Teams that use it well also apply it proactively, comparing performance before and after a deployment, watching resource trends for capacity planning, and catching internal degradation before it crosses the threshold that triggers an external uptime alert.
If your app handles payments, health data, or anything with significant regulatory requirements, that proactive use of APM can matter more than waiting for an outage to justify it.
Most teams follow a sensible order: start with uptime monitoring because it's fast and affordable, then add APM once the architecture is complex enough, or the stakes are high enough, to justify it. If your team is small and your stack is simple, adding APM prematurely can create noise, cost, and dashboards nobody has time to use.
That said, the need for APM can arrive earlier than team size alone would suggest, particularly if downtime carries serious financial or compliance consequences.
Uptime Monitoring vs APM: Cost and Complexity Trade-Offs
The cost conversation isn't just about subscription prices. Total time, implementation effort, and ongoing complexity matter too.
- Uptime monitoring typically has low setup complexity and fairly predictable pricing tied to monitor count and check frequency. You configure a check, set up alerting, and mostly forget about it until something goes wrong.
- APM involves higher setup complexity, including installing agents, configuring instrumentation, and tuning sampling rates so you're not drowning in trace data or paying for data you'll never review. Pricing can scale unpredictably as traffic or host count grows.
- The hidden cost of APM isn't just the invoice. It also includes the engineering time spent configuring traces, building dashboards, and tuning alerts so they're useful rather than noisy.
- The hidden cost of skipping uptime monitoring can be worse. Undetected outages quietly erode customer trust and breach SLAs long before an APM alert fires, since APM generally assumes the application is up and running in the first place.
A quick checklist for evaluating any monitoring tool:
- Does it offer full API access and data export?
- What exactly drives the price as you scale?
- Where is your data hosted and processed?
- Does it support relevant GDPR and data residency requirements for your business?
- How much engineering time will it realistically take to get useful signal rather than raw noise?
Full disclosure: I work on Moonitor, which covers HTTP/S, API, server, cron job, SSL, and DNS monitoring under one dashboard. I think it's a solid way to get broad uptime coverage without the hassle of instrumenting your whole codebase, but I'd say that about any well-built uptime monitoring tool, not just ours. Whatever you choose, the sequencing advice below holds regardless of vendor.
How to Choose the Right Monitoring Combination
If you're not sure where to start, here's a practical sequence:
- Map what actually needs watching: Public endpoints, APIs, scheduled jobs, SSL certificates, and DNS records. You can't monitor what you haven't identified.
- Set up uptime monitoring first: It's fast, low-cost, and catches many of the common failure modes teams actually run into.
- Configure real-time alerting: Use Slack, Discord, Telegram, email, or webhooks so the right person gets notified immediately instead of finding out from an angry customer email.
- Add a public status page: Keep customers informed during incidents without flooding your support inbox with "is your site down?" tickets.
- Watch response-time analytics and incident history: Look for patterns that hint at deeper performance issues.
- Bring in APM once you see concrete triggers: Recurring high p95 latency, unresolved dependency failures, frequent rollback-worthy regressions after deployments, or a mean time to resolution that keeps climbing are all good signals.
- Consider infrastructure monitoring or RUM: Use these when symptoms point to resource exhaustion, container health, or inconsistent real-user experience rather than a specific code path.
- Insist on full data export and API access: Whichever tools you choose, check data residency terms if UK data protection compliance matters for your business, so you're not locked into a platform your team has outgrown.
FAQ: Uptime Monitoring vs APM
Do I need APM if I already have uptime monitoring?
Not necessarily. If your main concern is knowing when a website, API, or server goes down and getting alerted quickly via Slack, email, or Telegram, uptime monitoring covers that well on its own.
APM becomes worth adding when you regularly troubleshoot performance issues inside complex, multi-service applications where the app is technically "up" but something internal is slow or broken. Keep in mind APM isn't a universal fix either: resource or user-experience problems may call for infrastructure monitoring or RUM instead.
What's the difference between uptime checks and performance monitoring?
Uptime checks measure availability and response time from an external vantage point. They ask: "Can a user reach this right now, how fast is it, and is the right content showing?"
Performance monitoring through APM goes deeper, tracing what's happening inside your application code, database queries, and service-to-service calls to explain why something is slow, not just that it is.
Which tool should a small team start with?
Almost always, uptime monitoring. It's quick to set up, inexpensive, and catches the failures that matter most early on: outages, SSL expiry, cron job failures, and DNS changes.
APM tends to make more sense once you have multiple services, a dedicated backend team, and specific performance problems that external checks can't diagnose.
Can uptime monitoring and APM data work together?
Yes, and ideally they should. A common workflow lets uptime monitoring fire the first alert when something's externally wrong, then uses APM traces to investigate the internal root cause.
Look for monitoring platforms with a full API and data export so you can send uptime data to other tools or dashboards without vendor lock-in.
Final Takeaway: Uptime Monitoring vs APM Is About Sequencing
Really, uptime monitoring vs APM isn't a competition. It's a question of sequencing and stakes.
Get the outer alarm system in place first. Uptime monitoring is fast, affordable, and catches the failures that matter most to your users, and to your own sleep schedule. Bring in APM, and possibly infrastructure monitoring or RUM alongside it, once your architecture, customer impact, or compliance requirements genuinely justify the investment.
That point arrives at a different time for every team, and that's fine. 🙂