
Uptime Monitoring vs. APM: What's the Difference and Which Do You Actually Need?
Confused about uptime monitoring vs APM? We break down what each actually tracks, when you need both, and how to choose based on your team size and bu
Uptime Monitoring vs APM: What's the Difference and Which Do You Need?
Meta description: Uptime monitoring vs APM explained: learn how each tool works, the key differences, and which monitoring solution your team should set up first.
If you've ever stared at two monitoring tool pricing pages at 11pm, wondering which one you actually need, you're not alone. It's one of the most common questions teams run into: what's the real difference between uptime monitoring and APM, and do you need both?
Here's the short answer. Uptime monitoring tells you whether your service is up, reachable, and responding correctly from the outside. APM (Application Performance Monitoring) digs into the internal reasons behind performance problems, tracing requests through your code and databases. For most small teams and solo developers, uptime monitoring is the sensible starting point. It's cheaper, faster to set up, and it catches the outages that actually wake people up at 3am. But that's not a universal rule. If you're running a complex distributed system, an API-heavy product, or a customer-facing platform where slow is just as damaging as down, APM might deserve a seat at the table earlier than you'd think.
Let's unpack both tools properly, figure out where the lines between them (and their monitoring cousins) actually sit, and work out how to know when it's time to add the second one.
What Is Uptime Monitoring?
Think of uptime monitoring as a check that visits your website or API on a schedule, from outside your infrastructure, just like a real visitor would. At its simplest, it doesn't care about your code, your database schema, or your server's internal metrics. It asks one question, over and over: is this thing reachable and behaving as expected right now?
That simplicity is the point, but it's worth being precise about what "uptime monitoring" actually covers, because the category is broader than a single ping. Basic checks confirm a server or port is reachable at the network level. That's necessary, but it doesn't tell you much about whether your application itself is healthy. More capable synthetic checks go further: multi-step transactions that simulate a login flow, keyword checks that confirm the right content loaded, and response-time measurements that flag when a page is noticeably slower than usual. All of these still run externally, without touching your code, which is what keeps setup fast and low-friction compared to instrumentation-based tools.
Common Uptime Monitoring Checks
A solid uptime monitoring setup usually covers a handful of core monitor types:
- HTTP/S checks – confirming your site or API returns the expected status code
- Keyword monitoring – checking that a specific word or phrase actually appears on the page (because a 200 OK response showing an error page is still broken)
- Port and ping checks – verifying that a server or service is reachable at the network level
- SSL certificate monitoring – catching certificates before they expire and start throwing browser warnings at your users
- DNS monitoring – alerting you if your DNS records change unexpectedly, which can be an early sign of hijacking or a misconfigured update (it's a detection layer, not a prevention one, so pair it with registrar-level security and MFA)
- Cron and heartbeat monitoring – making sure scheduled jobs and background tasks actually ran, not just that your server is technically online
It's also worth knowing where uptime monitoring stops and other categories begin. Infrastructure monitoring tracks server-level resources like CPU and memory. Log management and error tracking capture what's happening inside your application's logs and exceptions. Real-user monitoring (RUM) measures actual visitor experience in the browser. Uptime monitoring is the outside-in layer that sits apart from all of these. It's your independent source of truth that nothing internal can compromise.
Why Multi-Region Uptime Checks Matter
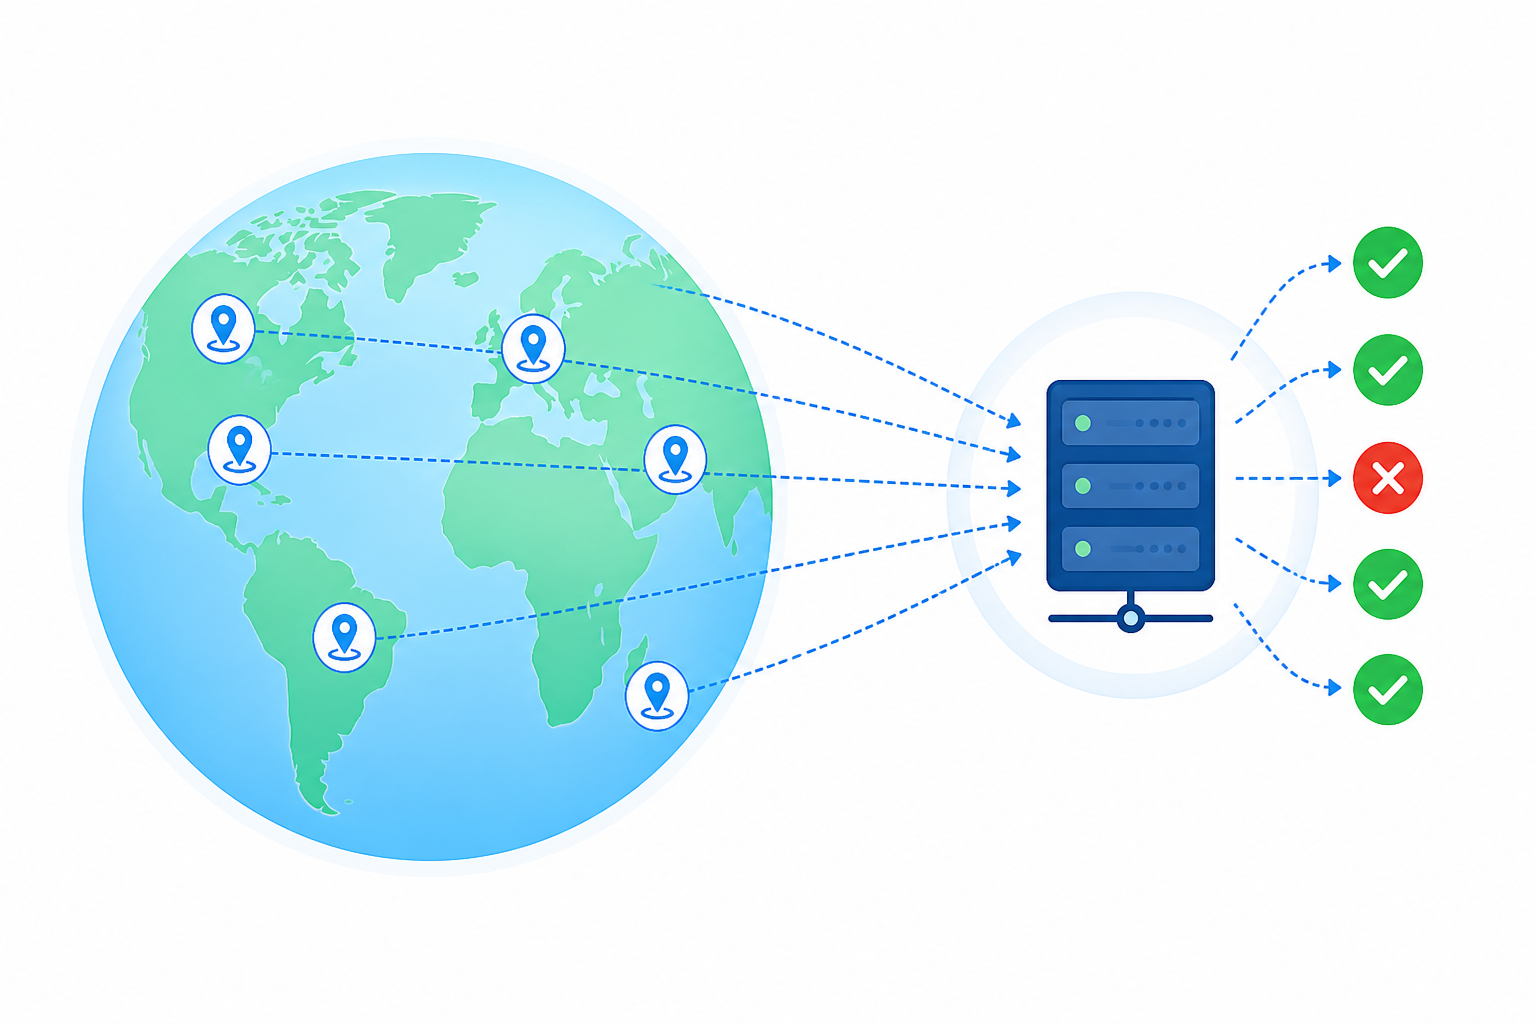
One thing that gets overlooked a lot: where the check comes from. A single monitoring location can get a bad reading from its own network blip and send you a false alarm at 2am for nothing. Checking from several locations before firing an alert means a hiccup in one data centre doesn't trigger a page-wide panic. Most established uptime tools, including Moonitor, build this in as standard.
What Is APM (Application Performance Monitoring)?
If uptime monitoring is the external check confirming the lights are on, APM is more like having sensors wired throughout the building, watching what's actually happening inside in real time. APM gives you internal, white-box visibility by instrumenting your actual code to trace requests as they move through your application, database queries, and individual services.
Where uptime monitoring answers "is it up?", APM answers "why is it slow, and roughly where?" It typically captures things like:
- Transaction traces showing the path a request takes through your application, broken down by service and span
- Slow query logs pinpointing which database calls are dragging things down
- Memory and CPU profiling to catch leaks or resource spikes before they cause an outage
- Error rates tied to specific services or endpoints, so you can narrow in on what's misbehaving
It's worth setting expectations accurately here: APM doesn't automatically hand you "the exact line of code." What it gives you is a trace, often down to a specific service, method, or query, and getting from there to a precise line usually takes additional profiling or source-map context. That's still a massive improvement over guessing, but it's a diagnostic starting point rather than a magic answer.
How APM Finds Internal Performance Problems
Here's a scenario I like using because it makes the difference click for most people. Your homepage returns a 200 OK. Your uptime monitor is happy, green across the board, and no alerts have fired. But under the hood, that page is taking eight seconds to load because of a database query that's scanning a table it shouldn't be. Uptime monitoring has no idea anything's wrong, because technically, the page did respond. APM is the tool that catches this, because it's watching what happens between the request coming in and the response going out.
The trade-off is setup complexity. APM usually requires installing an agent or SDK directly into your application code, which is a meaningfully bigger lift than pointing an uptime monitor at a URL. That's part of why APM tends to come later in a lot of teams' monitoring setups, though, as we'll get to, "later" isn't the right call for everyone.
Uptime Monitoring vs APM: Key Differences in the Data Collected
Once you see them side by side, the distinction gets a lot clearer. They're not competing tools; they're answering different questions with different data.
| Uptime Monitoring | APM | |
|---|---|---|
| Vantage point | External, black-box — checks from outside your infrastructure | Internal, white-box — instruments your actual code |
| Granularity | Up/down, response time, SSL status, and (with synthetic checks) multi-step transaction health | Traces down to services, methods, and queries — line-level detail usually needs added profiling |
| Setup complexity | Minutes — point it at a URL, port, or hostname | Install agents/SDKs and configure instrumentation |
| Best first question it answers | "Is this reachable and correct right now?" | "Where inside the system is this breaking or slowing down?" |
| Blind spots | Can't see inside your code or database | Doesn't give you an independent outside-in view if your whole instrumentation layer goes dark |
| Typical alert triggers | Downtime, SSL expiry, DNS changes, and missed cron jobs | Latency thresholds, error spikes, and memory leaks |
| Cost model | Commonly priced per monitor count | Commonly priced per host or event/transaction volume |
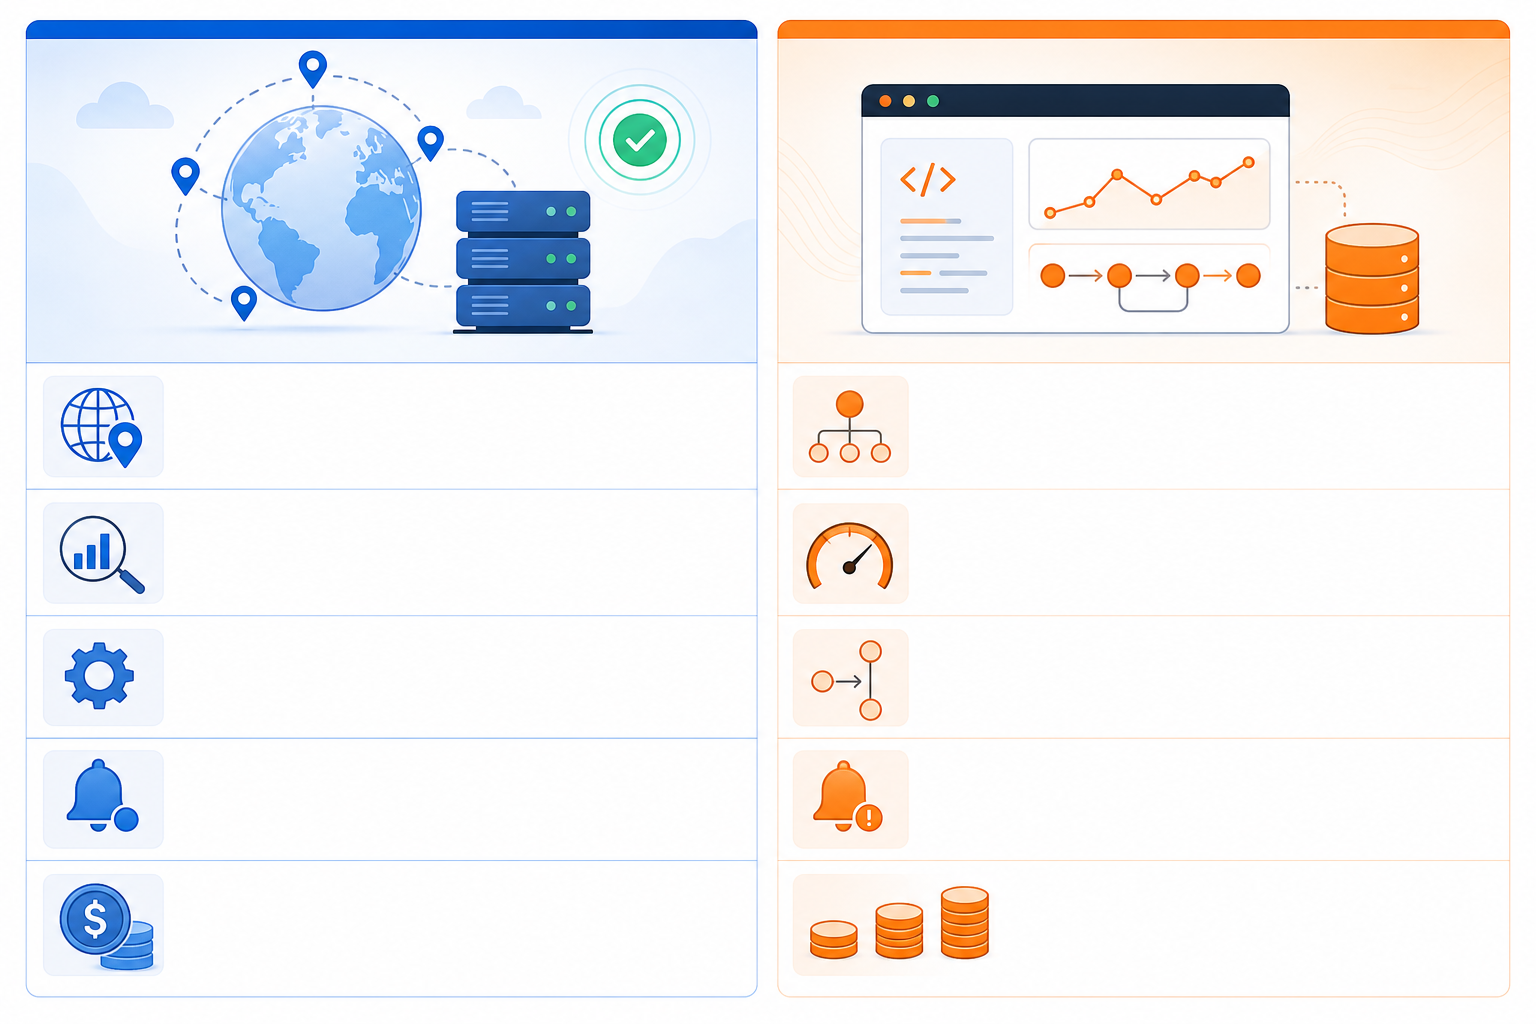
The cost model row is worth sitting with. Uptime monitoring tools often price based on how many things you're watching, which tends to scale predictably as you add servers, APIs, and scheduled jobs. APM tools commonly price based on traffic volume, event count, or number of hosts, and that can climb quickly as your app grows, sometimes faster than your revenue does. That's not a criticism of APM; it's just a reason to be deliberate about when and how you adopt it, and to read the pricing page closely before committing.
When Do You Need Both Uptime Monitoring and APM?
There's a common path a lot of teams follow. You start with uptime monitoring because it's the obvious first move: cheap, fast, and it catches the disasters. Then, months or years later, once you've got paying customers and real traffic, you start getting complaints that don't match what your dashboards are telling you.
Here's the classic tell: your status page shows strong uptime, everything's green, and yet customers are still emailing you to say the app feels slow. That gap between "technically up" and "actually usable" is your signal that it's time to bring APM into the picture. Uptime monitoring did its job. It confirmed nothing's broken at the surface level, but it simply wasn't built to surface internal performance bottlenecks.
That said, this sequence isn't the right order for everyone. If you're building a high-throughput API, a complex microservices architecture, or a product where latency itself is the thing customers pay for (think real-time trading, ad bidding, or anything with tight SLAs), the damage from "slow" can rival or exceed the damage from "down." In those cases, it can make sense to set up lightweight APM alongside uptime monitoring from day one, rather than treating it as a later-stage upgrade.
Where both tools really earn their keep is during incident response. Uptime monitoring tells you something broke and triggers your alerting the moment it happens: a page, a Slack message, or a call to your on-call engineer. APM then helps you narrow down where in the stack it broke, so you're not grepping through logs at random trying to find the culprit.
You also don't need to jump straight to full APM the moment performance complaints start. Response-time analytics from your existing uptime monitoring can act as an early warning system long before you need deeper instrumentation. If you're watching response times creep upwards over weeks, that trend line is often enough to tell you it's time to start budgeting for APM, before it becomes an emergency.
Choosing Uptime Monitoring or APM Based on Team Size and Budget
Team size is a useful rough proxy, but it's not the whole story. Architecture, traffic criticality, and how costly a slow-but-technically-up incident would be matter just as much. Here's how I'd think about it:
Solo developers and side projects – Uptime monitoring is almost always the right starting point. You likely don't have the traffic volume to justify APM pricing yet, and the failures that hurt most at this stage (downtime, expired SSL certificates, and silently failing cron jobs) are exactly what uptime monitoring catches.
Small startups (under 10 people) – Uptime monitoring plus basic server monitoring covers a large share of the incidents you'll face day to day, at a fraction of what APM would cost at this stage. The exception: if you're already API-first with paying customers who feel every millisecond, start weighing APM sooner.
Growing teams with real customer traffic – This is where APM typically starts earning its keep. Once you're debugging recurring slowness rather than outright outages, and support tickets mention "slow" more often than "down", it's time to bring APM in alongside your existing uptime checks.
Enterprise and complex-architecture teams – Run both in parallel as standard practice, regardless of headcount. Uptime monitoring stays your outside-in check that nothing internal can touch, while APM gives you the deep internal diagnostics needed to keep complex systems performant.
On the budget side, it helps to be concrete, with the caveat that pricing changes and you should always check current figures directly. As one example, Moonitor's published plans start at £14/mo for a Solo tier with a limited number of monitors, scaling up to higher tiers with more monitors included, with a free trial available. APM tools typically start at a higher base price and scale with traffic or host volume, which means costs can grow in a way that's harder to predict as you succeed. That pricing gap is a real factor in why uptime monitoring often comes first, but it should inform your decision alongside architecture and risk, not replace that thinking.
A Simple Uptime Monitoring vs APM Decision Framework
If you're still not sure where to start, here's a practical framework to work through:
Ask yourself: do I know within minutes when my site, API, or server goes down? If the honest answer is no, start with uptime monitoring today. For most teams, this is the single highest-leverage monitoring decision you can make.
Check whether you're monitoring scheduled jobs and background tasks. Cron and heartbeat monitoring exist for a reason: these failures are silent by nature, and you often won't notice until something downstream breaks badly.
Set up SSL certificate monitoring and DNS monitoring. Expired certificates and unexpected DNS changes blindside even experienced teams. These monitors detect the problem quickly, so pair them with strong registrar security, including MFA and registry locks, to reduce the chance of it happening in the first place.
Honestly assess your risk profile. If you're running a complex, API-heavy, or latency-sensitive system, don't wait for complaints. Consider introducing lightweight APM alongside your uptime monitoring now rather than later.
For everyone else, watch your response-time analytics once uptime monitoring is solid. If latency is creeping up or behaving inconsistently, that's your cue to start evaluating APM seriously.
When you do add APM, keep uptime monitoring running in parallel. Don't replace one with the other. They answer different questions, and you want that independent, outside-in check no matter how sophisticated your internal tooling gets.
Frequently Asked Questions About Uptime Monitoring vs APM
Is uptime monitoring the same as APM?
No. Uptime monitoring checks your service from the outside to confirm it's reachable and responding correctly, while APM instruments your actual application code to show you why something is slow or failing internally. They answer different questions and sit in different layers of your stack. Most teams running production systems eventually use both.
Do I need APM if I already have uptime monitoring?
Not necessarily right away. Watch for the symptoms that signal an APM gap: response times creeping up over weeks even though uptime checks stay green, users reporting "slow" rather than "down", or recurring errors concentrated in one service that you can't isolate from the outside. If none of that applies yet, uptime monitoring alone may be enough for now.
Which tool should a small team start with?
For most small teams, uptime monitoring. It's faster to set up, cheaper, and catches the failures that cause the most damage early on: your site going down, SSL certificates expiring, cron jobs silently failing, or DNS records changing unexpectedly. The exception is a small team running a latency-sensitive or API-first product, where even brief slowdowns cost real money. In that case, it's worth evaluating lightweight APM sooner rather than later.
Can uptime monitoring detect performance issues?
To a degree, yes. Response-time analytics from your uptime monitoring tool will show you if a page is responding slower than usual, which is often the first visible sign something's wrong. But it generally can't tell you which database query or service is causing the slowdown. Narrowing that down is where APM's tracing takes over.
The Bottom Line: Which Monitoring Tool Should You Choose?
This isn't really a competition between uptime monitoring and APM. It's about matching the tool to your actual risk. If you don't have reliable outage detection yet, get uptime monitoring in place first; that's the highest-leverage move for almost any team. If you're already seeing recurring latency complaints or errors you can't trace from the outside, it's time to add APM, regardless of team size. And if you're running a production system where slow is as costly as down, it's worth running both from the start. Whichever stage you're at, your 3am self will thank you for picking the right tool for the problem you actually have.