
API Monitoring Best Practices: 10 Ways to Keep Your Endpoints Reliable
Use this 10-point API monitoring checklist to track uptime, validate critical endpoints, monitor response times and dependencies, and reduce noisy alerts.
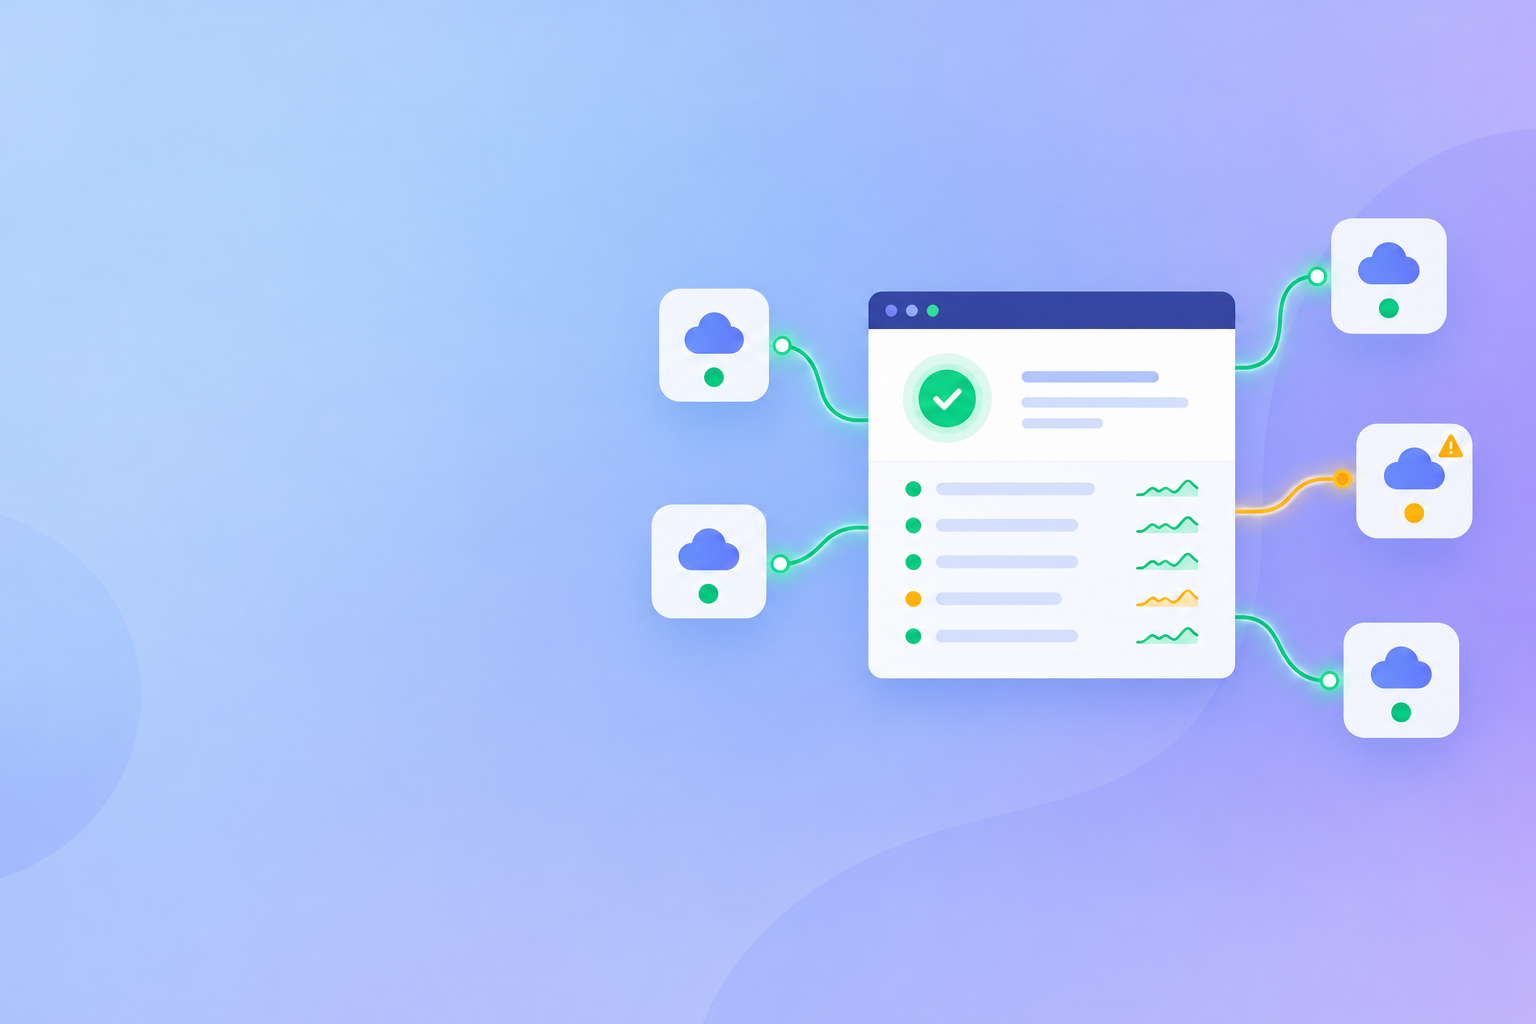
Good API monitoring means checking the endpoints that matter most, validating what they return (not just that they respond), and alerting only when a failure is real. Start with a dedicated health endpoint, monitor from multiple regions, track response-time trends, and watch your third-party dependencies. The ten practices below each come with a short rationale and a configuration tip, so you can tighten your setup in an afternoon. ☕
Why a Green Root URL Doesn't Mean Your API Is Healthy
Picture this. It's a quiet Tuesday afternoon, and your monitoring dashboard is a calm wall of green. The homepage returns a lovely 200 OK. Meanwhile, the checkout endpoint has been quietly throwing errors for the last hour, and the first you hear of it is a customer email that starts with "Hi, not sure if this is a known issue..."
That's the gap between basic website monitoring and real API uptime monitoring. A root URL check tells you the front door is open. It says nothing about whether authentication works, whether payments go through, or whether your webhook receiver is still accepting events. Your API is a collection of routes, each with its own failure modes, and each deserves attention proportional to what it costs you when it breaks.
So here are ten practices, each with a short why and a how to configure it tip. They work with any tool. Where I give examples, they come from how we set things up in Moonitor, but the thinking carries over anywhere. You don't need to do everything today. Start with whatever hurts most.
1. Monitor Critical API Endpoints, Not Just the Root
Which API endpoints should I monitor? Start with the ones where an outage costs you money, trust or sleep. Prioritise by business impact:
- Authentication: if people can't log in, nothing else matters.
- Payments or checkout: the most expensive place to fail silently.
- Core read/write resources: the routes your product is actually built on.
- Webhook receivers: easy to forget, because no human hits them directly. Other systems depend on them, though, and they fail quietly.
A simple rule of thumb: if an outage would trigger a support ticket within ten minutes, it gets a monitor.
There are two honest caveats. First, "every critical route" still has limits. Each monitor uses part of your plan's allowance and adds a little traffic to your API, so be selective and start with the handful of routes your business can't live without. Second, an external check can only verify what it can safely do from outside. Don't point a monitor at a route that creates orders, sends emails or charges cards in production. Use a read-only route, or a clearly flagged test or sandbox path, and be clear with yourself about what a green tick does and doesn't prove.
Config tip: create one HTTP/S monitor per critical route and name them by function, like "API - Login" or "API - Create Order (sandbox)". When an alert lands at 2am, a name like that tells you what's broken before you've even opened your laptop.
2. Build a Dedicated API Health Check Endpoint
What is a good health check endpoint? It's a lightweight route that tells a monitor whether your service can do its job. The trick is not cramming everything into one route. I like to think of three distinct jobs:
| Check | Question it answers | Typical route | Who can call it |
|---|---|---|---|
| Liveness | Is the process running? | /health/live |
Public or internal, minimal response |
| Readiness | Can this instance serve traffic right now? | /health/ready |
Usually internal or restricted |
| Diagnostics | Which dependency is struggling, and why? | /health/details |
Authenticated or allow-listed only |
The Kubernetes documentation on liveness and readiness probes explains why the split matters. A failing liveness probe tells the orchestrator to restart a container, and a failing readiness probe tells it to stop sending traffic. If you tie liveness to a downstream database, a brief database wobble can trigger needless restarts across every instance. So keep liveness shallow.
Readiness deserves a little care too. Include only the dependencies your service genuinely can't work without, such as its primary database. If a nice-to-have dependency (say, a recommendations service) is down, it's usually better to degrade gracefully and report it in your diagnostics than to fail readiness and pull every instance out of rotation at once.
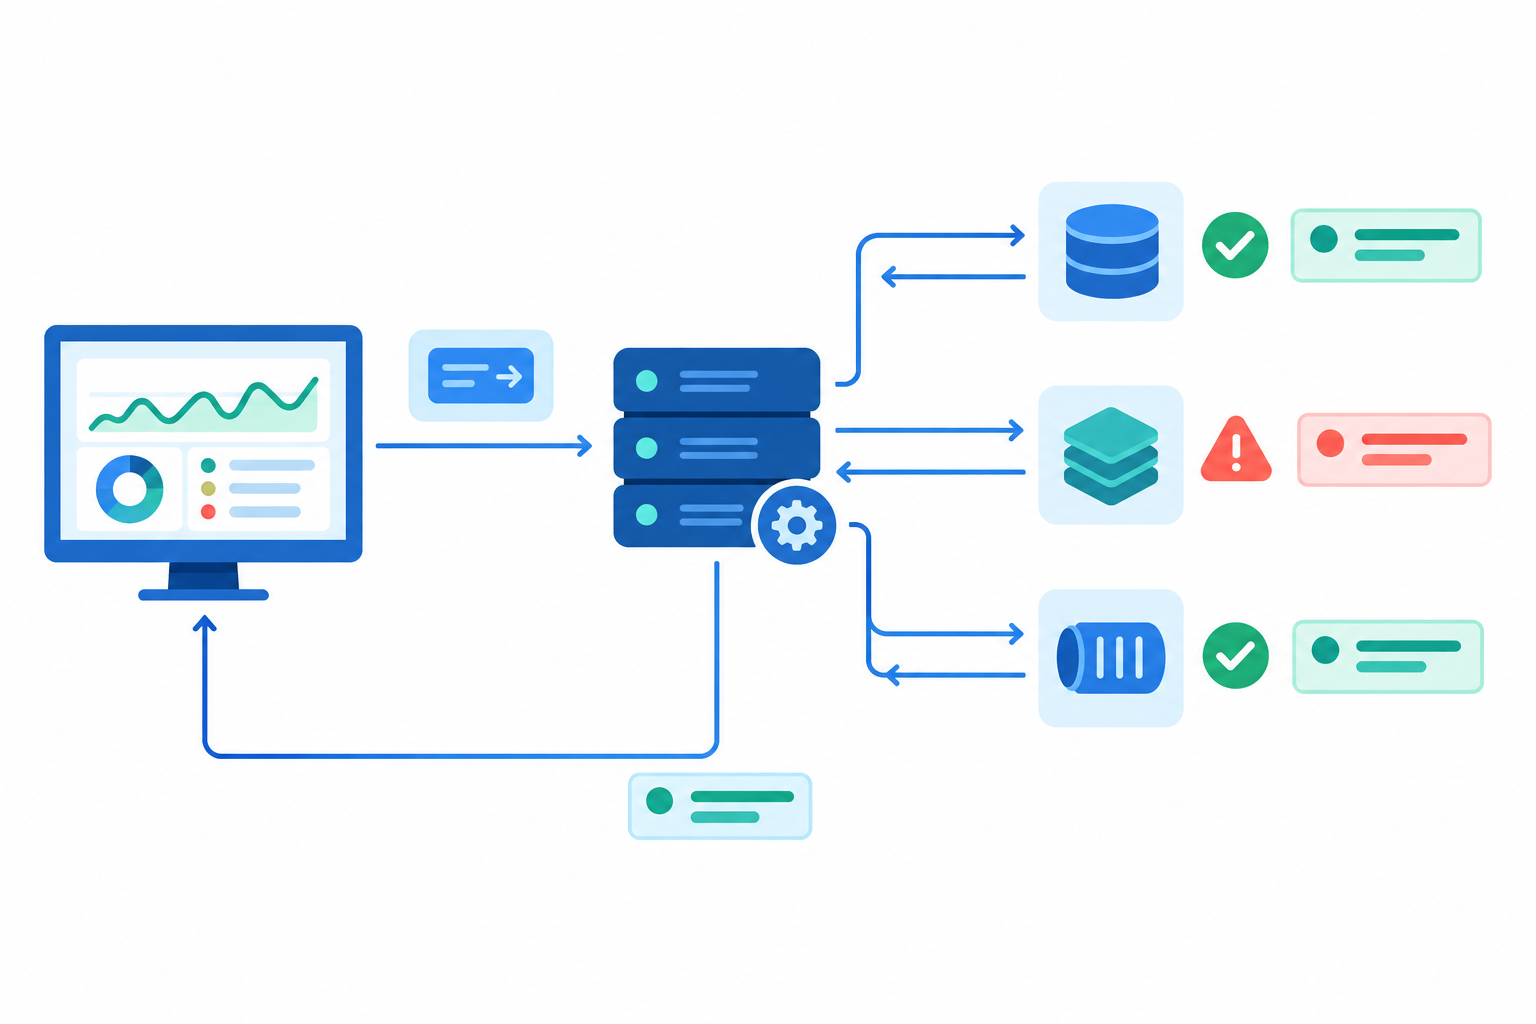
A few habits make health endpoints work well:
- Keep it fast and light. If the health check is slow, it becomes a problem of its own.
- Keep the public response minimal. A bare
{"status":"ok"}is fine for an unauthenticated liveness route. Never expose secrets, internal topology, dependency names or detailed exception messages there. Put that detail behind authentication or an IP allowlist, and in secured logs. - Monitor it from outside. Internal probes from your orchestrator or load balancer confirm instance health, but an external check can reveal failures along the network and routing path your users actually rely on.
Config tip: return 200 when healthy and 503 when not, with a small JSON field you can validate, such as {"status":"ok"}. Point your external monitor at the minimal public route, and add a second monitor on the restricted readiness or diagnostic route using a header-based credential. Then you can pair your API uptime check with a content check (more on that next).
3. Check API Status Codes and Response Content
Here's a sneaky one: a 200 with an error body. Your framework catches an exception, wraps it in a friendly JSON message, and still returns 200. Or the payload comes back empty. Every simple uptime check says "all good", and your users disagree.
To catch these silent failures:
- Define expected status codes explicitly. If a route should return 200, treat anything else as a problem. Depending on the endpoint, an unexpected 3xx redirect (say, to a login page) deserves the same treatment.
- Use keyword or content checks. Confirm that a known string or JSON field is actually present in the response.
- Test negative cases. A protected route should return a 401 when called without credentials. If it suddenly returns 200, that's a much scarier failure than downtime.
Config tip: pair an HTTP/S monitor with keyword matching on a stable field in the response, such as the status field from your health endpoint. Pick something that rarely changes, or you'll be updating monitors after every release.
4. Track API Response-Time Trends, Not Just Uptime
Slow is the new down. An API that responds in eight seconds is technically up, but your users have already given up, and latency creep often shows up well before an outage does.
The pattern is a familiar one. A new feature ships with a query that isn't indexed, or a small memory leak creeps in. Nothing falls over. Response times just tilt upward, a little more each day, until one busy morning the whole thing tips into timeouts. Anyone glancing at the trend graph a week earlier would have spotted the slope.

Two things help here.
First, think in percentiles, not averages. Google's SRE guidance on monitoring distributed systems recommends treating latency as a distribution, because averages hide the slow requests a small but important share of users experience. In practice, that means:
- Look at p95 and p99 for each endpoint, not one service-wide number, since a regression on a single route can vanish into a blended average.
- Agree a target, for example "99% of login requests complete within 800ms", and compare your trend against it.
- Treat a steady upward drift in p95 as worth investigating even while everything is technically up.
Second, pair latency with an availability target. A 99.9% availability objective allows roughly 43.8 minutes of unavailability in a 30-day month, but an endpoint can hit that figure while its response times quietly get worse. Uptime alone can look healthy while the experience degrades.
External monitors typically report the response time they observe per check, so even without internal instrumentation you'll see the trend. Keep in mind that this includes network time from the probe's location, so it's best for spotting change over time rather than judging absolute server speed. If you do have internal metrics, compare latency with traffic, errors and saturation, which Google calls the four golden signals. That helps you tell "slow because we're busy" from "slow because something's broken".
Config tip: set a response-time threshold slightly above your normal baseline, and review it after each release. A weekly glance at the graphs is a habit worth building.
5. Choose the Right API Monitoring Check Interval
How often should I check my API? It depends on what a minute of downtime costs you. Faster checks detect problems sooner, but they use up monitor allowances on your plan and can produce more noise if you don't pair them with confirmation checks.
| Interval | Best for | Detection speed | Noise risk |
|---|---|---|---|
| 30 seconds | Payments, authentication, revenue-critical routes | Fastest | Higher without confirmation checks |
| 1 minute | Core API resources, webhook receivers | Fast | Moderate |
| 5 minutes | Internal tools, low-traffic or secondary endpoints | Slower | Low |
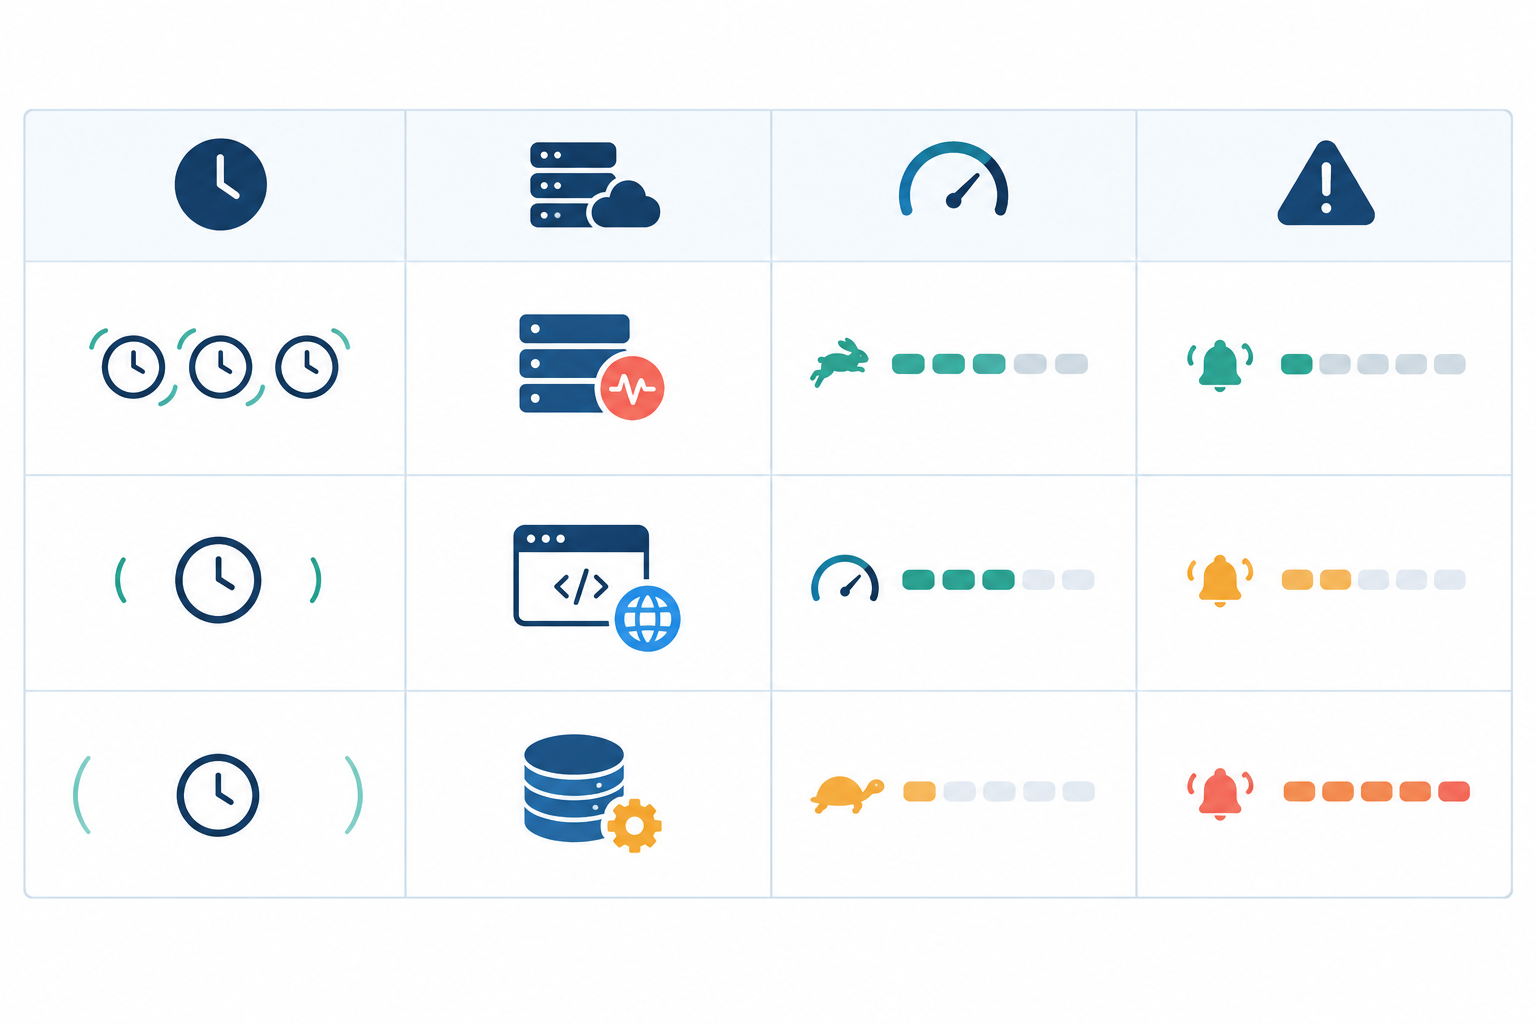
Your real time-to-detect isn't just the interval, though. It's roughly the interval multiplied by however many confirmations you require before alerting, plus the time taken to verify from other regions. A one-minute interval with two consecutive failures required means you'll typically hear about it in around two minutes.
Config tip: check critical endpoints most frequently and use longer intervals for secondary routes. Spend your monitor budget where downtime hurts.
6. Monitor Authenticated API Endpoints Safely
How do I monitor authenticated endpoints? Carefully, and with a dedicated identity. Here's the sequence I'd follow:
- Create a dedicated, least-privilege account. Make a service account or read-only API key used only for monitoring. If it leaks, the damage should be minimal.
- Send credentials in headers. Use an
Authorizationbearer token or API key header, if your monitoring tool supports custom headers, rather than embedding secrets in URLs, which end up in logs. - Rotate on a schedule, and note the expiry. Nothing's more annoying than a 3am alert caused by your own monitoring token quietly expiring. Put the expiry date in your calendar.
- Pick a safe, idempotent endpoint. Use a GET route that exercises authentication without changing any data.
- Never use real user or admin credentials. Not even "just for now". Temporary has a way of becoming permanent.
Config tip: monitor a read-only route such as GET /api/v1/me or GET /api/v1/orders?limit=1 with an Authorization: Bearer <token> header, and keep the token in your monitoring tool's secret or encrypted header field rather than in a shared document or the URL. Then set up two separate checks so your alerts tell you why something broke. One expects a 200 with a valid token, and a failure there means the route or the auth system is unhealthy. A second, optional check expects a 401 without a token, which confirms the route is still protected. If the first starts returning 401 and nothing else has changed, it's most likely your token expiring, so rotate it before assuming an outage.
7. Verify API Failures from Multiple Regions
A single monitoring location is a bit like asking one friend whether your website is down. Maybe it is. Or maybe their Wi-Fi is playing up. Single-location checks regularly produce false alarms from transient network blips that have nothing to do with your API.
Multi-region failure verification fixes this. When one location sees a failure, other locations re-check before anyone is alerted. If they all agree, it's real. If they don't, it was a blip and your phone stays quiet.
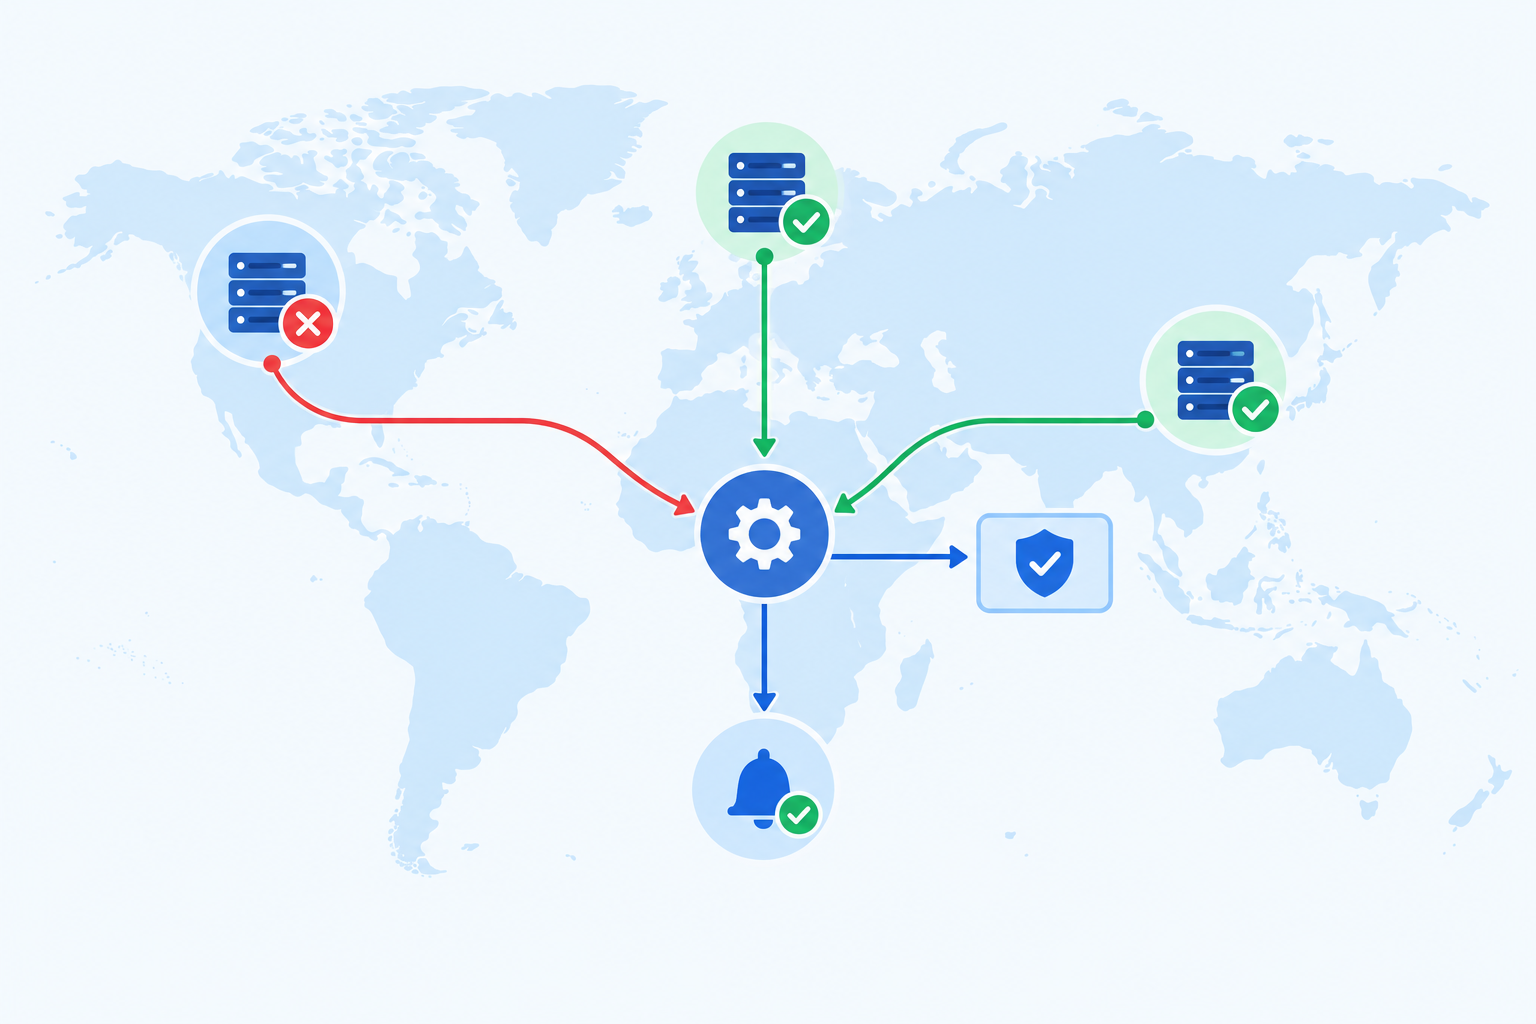
If most of your customers are in the UK, this matters in two ways. Choose at least one probe close to them, such as London or elsewhere in the UK, so you see roughly what they see. Then add one or two farther afield, say Frankfurt or the US East Coast, so you can tell a UK-side routing problem from a genuine outage. If your London check fails while Frankfurt and Virginia pass, you're probably looking at a regional network issue rather than a dead API, and that changes what you tell customers. If everything fails, it's you.
Real incidents show why. Cloudflare's post-mortem of its June 2022 outage describes a network configuration change that affected 19 data centres, so users in some locations saw failures while others didn't. A single probe in the wrong place would have given you a misleading picture either way.
Whichever regions you pick, base them on where your customers actually are rather than on a default list. Check your analytics, then add probes accordingly.
Config tip: enable confirmation checks so a single timeout doesn't wake someone at 3am. This is one of the biggest wins against alert fatigue, and it's built into Moonitor's approach to incident alerting.
8. Monitor Third-Party API Dependencies and Infrastructure
Your API is only as reliable as the payment gateway, email provider, auth service and DNS it leans on. A basic health check can pass while a payment or identity integration is failing, and shared infrastructure can take down a perfectly healthy app. AWS's own summary of its December 2021 US-EAST-1 event describes elevated error rates and latency that hit many services and customers for hours.
It helps to separate two different questions:
- Is the provider up? Watch the provider's public status page or a lightweight availability check, so you can tell an upstream failure from your own.
- Does our integration work? Check the thing you actually depend on, such as whether your API can reach the payment gateway's sandbox with its credentials, or whether the response shape is still what you expect.
Dependency probes should be safe (no real charges or emails), bounded (short timeouts, modest frequency so you don't hammer someone else's service) and useful for diagnosis. You don't need a monitor for every vendor. Prioritise the ones whose failure breaks a critical route.
There's also a supporting cast worth watching:
- SSL certificate and domain expiry. An expired certificate takes down an otherwise healthy API instantly, and it's entirely preventable.
- DNS. Detect unexpected record changes, whether from a misconfiguration or something more sinister.
- Servers. Port and ping checks on the hosts behind your API tell you whether the machines are reachable at all.
- Heartbeats. For cron jobs and background workers that feed your API, have the job ping a monitor when it finishes. If the ping doesn't arrive on schedule, you get an alert. It's the easiest way to catch cron jobs that silently stop running.
Config tip: add a monitor for each external service that a critical route depends on, or surface that status in your restricted diagnostics endpoint. Also set explicit timeouts on outbound calls, and use bounded retries with backoff. Unbounded retries can pile load onto an already struggling dependency.
9. Set API Alert Thresholds That Avoid Noise
Alert fatigue is real. Once your channel is full of false alarms, people start muting it, and the one real incident gets lost in the pile. Good alerting is mostly about restraint.
- Route by severity. Send critical alerts to Slack, Telegram or Discord, with on-call escalation, and minor ones to email. If your team works UK hours, decide who is paged out of hours so a 3am alert doesn't land with nobody.
- Use webhooks to feed your incident tooling or trigger automation when a monitor changes state.
- Require confirmation. Ask for consecutive failures or multi-region confirmation before alerting, and always send a recovery notification so people know when to stand down.
- Say what, where and since when. "API - Login failed from 2 regions since 14:03" beats "Monitor 4 is down" every time.
Config tip: if you only change one thing, make it the confirmation requirement. Most one-off blips disappear.
10. Communicate and Learn with Status Pages and Incident History
When something does go wrong, a public status page cuts your support load and builds trust. Customers who can see "We're aware and investigating" are far less likely to open tickets, and far more likely to forgive the hiccup.
Incident history is the quieter benefit. Review it and you'll start to see patterns: the same endpoint failing after every Friday deploy, or a certificate that keeps sneaking up on you. That makes post-incident reviews far more useful than relying on memory.
It's also worth being able to get your data out. A full API and data export means you aren't locked in, and you can feed your own dashboards.
Config tip: publish only customer-facing components on your status page, with plain-English names. "Login" and "Payments" mean something to customers. "auth-svc-eu-2" doesn't.
API Monitoring Best Practices: Quick-Start Checklist
Here's the whole list in a form you can copy:
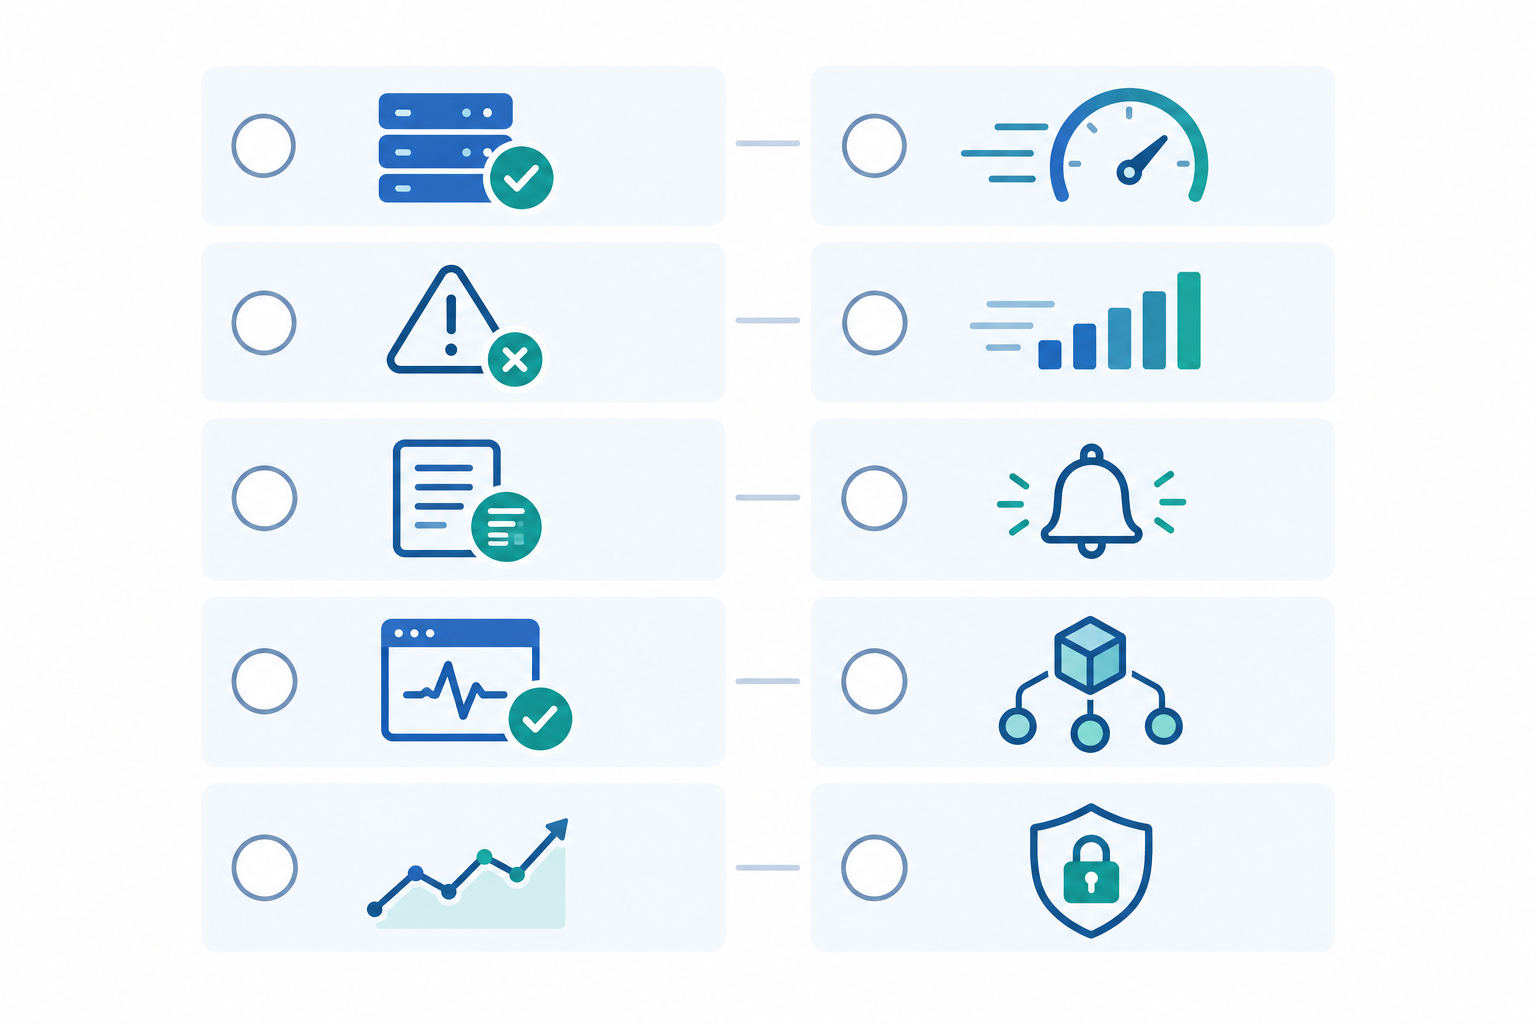
- Monitor critical endpoints individually, named by function.
- Split health checks into liveness, readiness and restricted diagnostics.
- Validate status codes and response content, not just reachability.
- Watch per-endpoint percentile trends, not only up or down.
- Match check intervals to business impact.
- Monitor authenticated endpoints with a dedicated, least-privilege credential.
- Verify failures from multiple regions before alerting.
- Monitor dependencies: SSL, DNS, ports, heartbeats and the third parties your critical routes need.
- Alert by severity, with confirmation and recovery notices.
- Publish a status page and review incident history.
A 30-Minute API Monitoring Starter Plan
If you've got half an hour, here's exactly what I'd do:
- Minutes 0-10: add a health endpoint. Create
/health/livereturning{"status":"ok"}with a 200. - Minutes 10-20: set up three monitors. Use your login route, your main read endpoint (a safe GET) and the health endpoint. Name them "API - Login", "API - Core Read" and "API - Health". Set a 1-minute interval, expect a 200, and add a keyword check on
"status":"ok"for the health monitor. - Minutes 20-25: connect one alert channel. Pick Slack or email, and require two consecutive failures or multi-region confirmation before alerting.
- Minutes 25-30: test it. Temporarily change the expected keyword to something that won't match, confirm you get an alert, then change it back and confirm you get the recovery notice.
That alone puts you well ahead of a root-URL-only setup. Layer on the rest as you go.
If you'd like somewhere to try it, Moonitor has a 7-day free trial with no credit card needed, and setup takes under a minute. 🌙
API Monitoring FAQ
What's the difference between API monitoring and API uptime monitoring?
API uptime monitoring answers a simple question: is the endpoint reachable and responding correctly? API monitoring is broader. It includes uptime, but also response-time trends, content validation, authentication flows and dependency health. Most teams start with uptime checks and add the rest later.
Should my health check endpoint require authentication?
It depends on what the endpoint reveals. A minimal liveness route that returns only a status such as {"status":"ok"} can be public. Readiness and diagnostic routes that reveal dependency status or internal detail should be protected with an API key or an IP allowlist, and you can monitor them using a header-based credential.
Can I monitor an API that sits behind an IP allowlist or VPN?
Yes, but you'll need to allow your monitoring provider's check IPs or expose a narrowly scoped health route. Alternatively, use heartbeat monitoring, where your internal service pings out to the monitor on a schedule, so nothing inbound has to be opened.
How do I avoid false alarms from my API monitoring?
Use multi-region failure verification, require more than one failed check before alerting, and set response-time thresholds based on real baselines. Together, these remove the majority of one-off network blips.