
Client Reporting Made Easy: A Guide to Uptime Analytics Agencies Can Share
Learn which uptime and response-time metrics to share, when to send reports, and how agencies can automate updates to demonstrate value and retain cli
Client Reporting Made Easy: Uptime Analytics Agencies Can Share
The best client uptime reports are short, visual and focused on outcomes: uptime percentage, incident history, response-time trends and upcoming risks like SSL or domain expiry. Send a concise monthly summary, back it with a branded status page so clients can see what's happening in real time, and use an API or data export to automate the heavy lifting. Done well, uptime reporting is proof of value that helps agencies keep clients and win new work.
That's the short version. The rest of this guide covers what to include, how to calculate and check the numbers, how often to send reports and how to build a workflow that takes minutes per client rather than hours. If you manage a handful of websites and APIs and want to turn centralised monitoring into reports your clients will actually read, grab a cuppa and let's dig in. ☕
Why Clients Need Regular Uptime Reports
Picture the typical client relationship. You build and maintain their site, you keep everything ticking along, and you hear nothing for weeks. Then one Tuesday morning the checkout breaks, the phone rings, and suddenly you're on a call explaining what happened. If that's the only time they hear from you about reliability, your agency looks reactive, even if you fixed the problem in ten minutes.
I think of this as the invisible work problem. When monitoring does its job, nothing happens. No drama, no outage, no angry emails. And because nothing happens, clients quietly assume nothing is being done. Come renewal time, 'what exactly are we paying for?' is a perfectly natural question.
A regular report turns that silence into evidence. It shows the checks that ran, the problems that were caught and the risks that never materialised. It builds trust before the renewal conversation rather than during it.
It also speaks to what clients really worry about, even if they never say it out loud:
- Lost sales while the site is down
- Missed enquiries from a broken contact form or API
- Embarrassing downtime that customers notice first
- Being the last to know about a problem
The stakes can be high. The Uptime Institute's Annual Outage Analysis 2024 found that 54% of respondents said their most recent significant outage cost more than $100,000, and 16% said more than $1 million. Those figures come from serious outages at organisations running substantial IT estates, not the average brochure site, so please don't wave them at a small client. They do show why evidence of reliability matters to people who depend on being online. If you quote the statistic in your own materials, check it against the original report first.
One more thing before we get into the metrics: accuracy. A report full of false alarms damages your credibility far more than it helps. If a client reads about three 'outages' that were really a single flaky network hop, they'll doubt every number you send. That's why I like a monitoring tool that confirms a failure from more than one location before raising an incident (Moonitor does this). It won't prove that every visitor saw the problem, since a regional routing issue can still affect some users and not others. But it cuts down on false positives, so your report is far more likely to reflect genuine downtime.
What Uptime Metrics Should You Share With Clients?
It's tempting to dump every chart your monitoring tool offers into a PDF. Resist that. Clients need a handful of numbers they can understand in half a minute. Here's what I'd include in a client uptime report:
- Uptime percentage per site or API. State the reporting period and give it plain-English context. In a 30-day month, 99.9% availability corresponds to about 43 minutes of downtime, and 99.99% to about 4 minutes. Be clear about what the number is. Your measured availability is what the monitoring recorded. A target or SLA is a commitment you've agreed with the client. Unless you have a contract that says otherwise, avoid implying that 99.9% is an allowance you're entitled to use up. 'We recorded 12 minutes of downtime this month, which is 99.97% availability' is clearer than a bare percentage.
- Incident history. For each incident, give when it happened, how long it lasted, the cause in one sentence, and what you did about it. Pair the percentage with this timeline, because a single long outage and ten tiny blips can produce the same figure and feel very different.
- Response-time trends. Show average, peak and trend, but frame it around what the monitor actually measures. A typical HTTP check records how long the endpoint takes to respond, which isn't necessarily the full page-load time a visitor sees in their browser. So say 'the monitored page responded in under a second on average, with one slow spell on the 14th' rather than 'pages loaded in under a second'. A site can be 'up' and still feel slow, so treat this as a trend signal, not a verdict on user experience.
- SSL certificate monitoring and domain expiry. List expiry dates and note any renewals you handled before they became problems. Clients rarely know these exist until one lapses.
- Cron job and heartbeat monitoring. If the client relies on scheduled tasks like backups, invoicing or data syncs, report whether those jobs checked in on time. A silent failed backup is exactly what clients want to hear you caught.
- DNS monitoring. Note any DNS record changes detected, especially unexpected ones. They signal both stability and security, and it's reassuring to say 'no unauthorised changes this month'.
A quick note on percentiles: you may see 'p95' in your tooling, meaning 95% of requests were faster than that value. It's handy for spotting slow experiences that an average hides, but it works better as an internal check than a client-facing number, unless the client is technical.
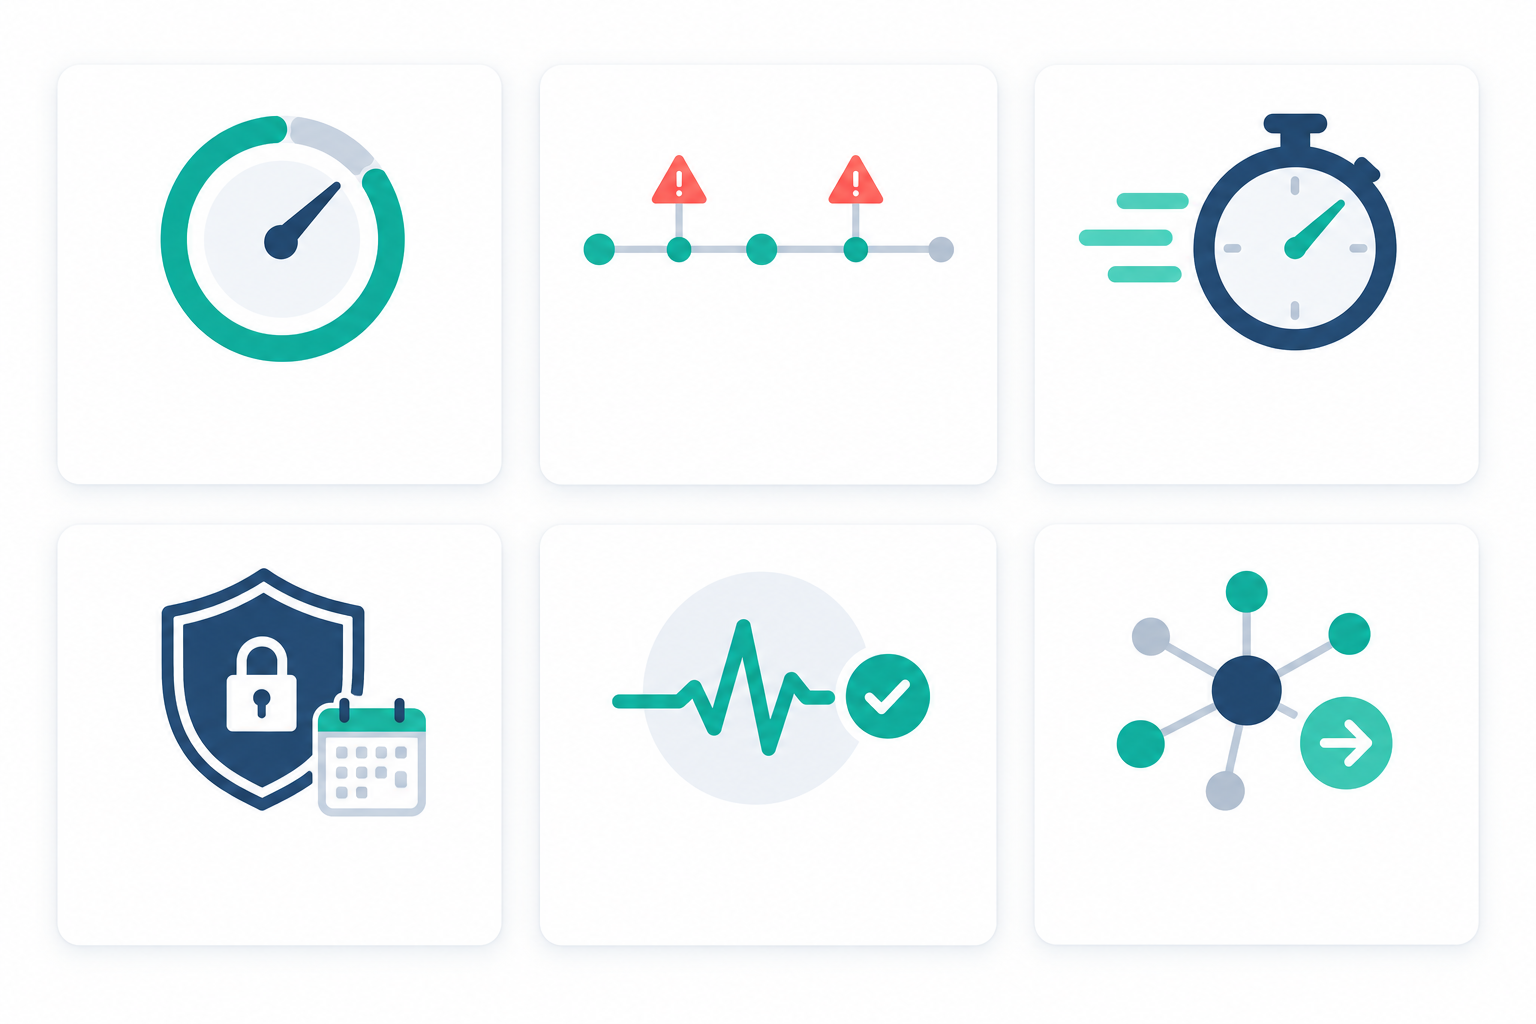
What uptime report details should you leave out?
Raw logs, every minor blip, and jargon only your developers care about. If the client wouldn't act on it or understand it, it belongs in your internal notes rather than their inbox.
Tailor uptime metrics to each client
Not every client needs everything:
- Brochure site: uptime, SSL and domain expiry, and a short incident note.
- E-commerce store: all of the above, plus response-time trends and keyword checks on key pages, such as confirming the basket page still loads correctly.
- SaaS product: uptime, response times, incident history and cron/heartbeat results for background jobs.
- API-driven service: API monitoring results, response-time percentiles and port checks, with incident detail front and centre.
Always explain how you measure uptime
A short footnote saves a lot of awkward questions later. Name the monitored URL, how often it's checked, which locations run the checks, and whether planned maintenance counts as downtime. If your clients are UK-based, quote times in UK local time (GMT or BST) and say so. Otherwise an incident logged at 02:00 UTC can look an hour out during British Summer Time.
How to Calculate and Validate Client Uptime Metrics
Before a figure goes in front of a client, it's worth knowing where it came from. Here's a simple checklist:
- Calculate availability from the period, not from checks alone. The basic formula is (total minutes in the period minus minutes of confirmed downtime) divided by total minutes in the period. Most tools do this for you, but know the formula so you can sanity-check it.
- Define an incident boundary. Decide when an incident starts and ends, for example 'from the first confirmed failed check to the first confirmed successful one'. Write it down and use it consistently. Otherwise one flapping service can look like five separate incidents.
- Decide how to treat planned maintenance. Many agencies exclude agreed maintenance windows from availability figures. Whatever you choose, state it in the report footnote.
- Look for gaps in the data. If a monitor was paused, or a data feed failed for a day, don't quietly report 100%. Flag it, or note that the figure covers only part of the period.
- Check the clock. Make sure the period boundaries and incident times use the same time zone across your report and your monitoring tool.
It adds a few minutes the first time you set it up. After that it becomes a habit, and it protects the credibility of every report you send.
Turning Monitoring Data Into Client-Facing Uptime Reports
Having the data is the easy bit. Shaping it so a busy managing director can absorb it over a coffee is where the skill is. Here's the routine I'd follow:
- Group monitors by client. Each report should cover only the sites, APIs, servers and jobs that client pays for. Nobody wants to wade through someone else's data, and it keeps things tidy for you too.
- Lead with a one-paragraph summary. Write it for a non-technical stakeholder who'll spend 30 seconds on it. Something like: 'All three of your sites stayed above 99.9% this month. One short incident on the 9th affected the booking form. SSL certificates are healthy until next spring.'
- Add two or three visuals. An uptime bar, a response-time trend line and an incident timeline are plenty. Add more and the report stops being scannable.
- Translate incidents into business impact. Don't just say 'HTTP 503 for 14 minutes'. Say 'the booking form was unavailable for 14 minutes at 7am, a quiet period, and we restored it within 6 minutes of the alert'. Show how quickly you responded and what the fix was.
- Finish with 'what we're watching next'. That might be upcoming certificate renewals, a slow page you're keeping an eye on, or an API that isn't monitored yet. Upsell opportunities show up here naturally, with no hard sell.
- Point to a branded public status page as the always-on companion. Clients can check health any time without emailing you, and it shows incident history as it happens.
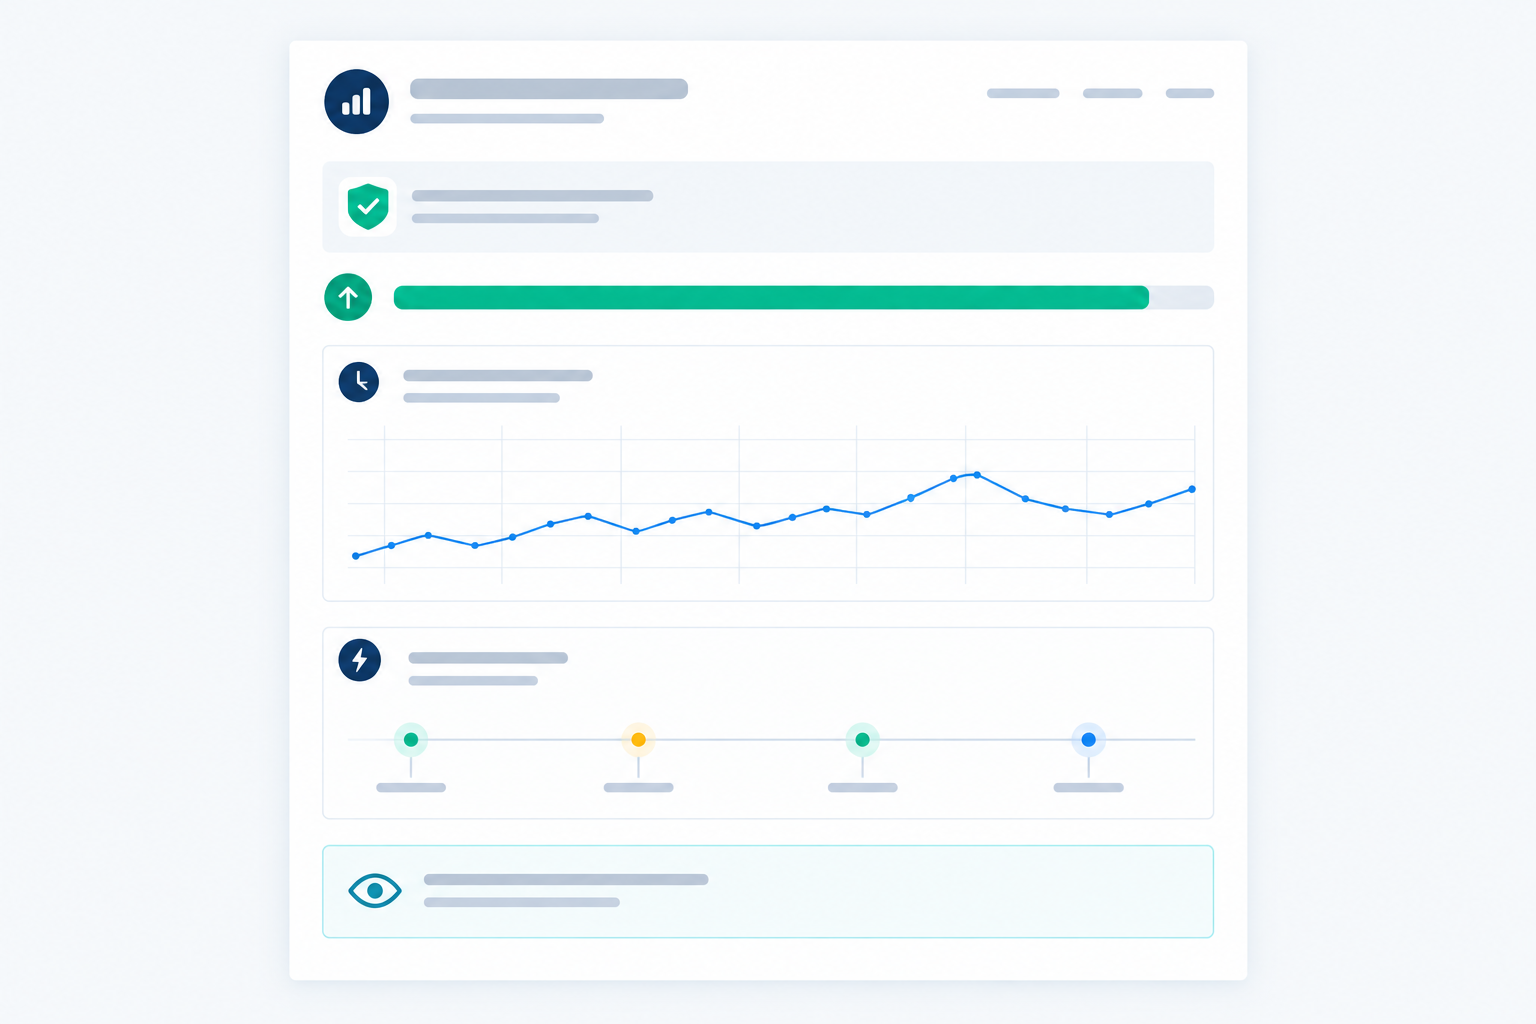
A good line versus a bad line in a client report
Bad: 'Monitor #4 returned timeout errors between 03:12 and 03:31.'
Good: 'Your online shop was briefly unreachable overnight (19 minutes, 3am, low traffic). Cause: a hosting provider network issue. We confirmed recovery and have raised it with them.'
Same facts, completely different reaction. Here's an illustrative scenario, not a documented case study. Imagine a freelancer whose client has been lukewarm about monitoring for a year. She adds a simple incident timeline to the next report: three tidy bars showing exactly when things broke and how quickly they were fixed. The client says, 'Oh, so that's what you've been doing.' Nothing technical changed. They could finally see the work.
How Often Should You Send Uptime Reports to Clients?
There's no single right answer, but there is a sensible default. Here's how the options compare:
| Cadence | Effort | Best for | Main benefit |
|---|---|---|---|
| Weekly | Higher (even if semi-automated) | E-commerce, API-dependent or high-stakes clients | Fast visibility and early trend spotting |
| Monthly (recommended default) | Moderate; a realistic target is around 15 minutes per client once your template is set up | Most retainer clients | Regular proof of value without overwhelming anyone |
| Quarterly | Low to moderate, but needs prep for a meeting | Strategic reviews, smaller or low-touch clients | Big-picture trends and planning conversations |
That 15-minute figure is a goal, not a promise. It assumes your template and data export already work, and it covers a quick review and a short written comment. A month with several incidents will take longer.
For most retainers, I'd go monthly, with a quarterly review meeting for the strategic stuff: trends over time, upcoming risks, and what the next three months might need. For high-stakes clients, such as shops where an hour of downtime costs real money, add weekly summaries or a short message after each significant incident.
What about the gaps between reports? That's what real-time tools are for. A public status page gives clients live visibility, and incident alerting via email, Slack, Discord or Telegram means you (and, if you choose, they) hear about problems as they happen. The report then becomes a calm look back rather than the first they've heard of anything.
One last practical tip: tie delivery to something that already happens, like your monthly invoice or a retainer review call. If you invoice monthly, sending the report alongside it quietly answers 'what am I paying for?' before anyone asks.
Can You Automate Client Uptime Reporting? Yes, Here's How
Mostly, yes. The trick is knowing which bits to automate and which to keep human. Here's a workflow that scales across lots of clients:
- Start with a consistent naming and grouping convention. Something like 'ClientName – Site – Check type'. It sounds dull, but it's what lets data map cleanly to the right client later.
- Let the status page and incident history do the zero-effort work. A branded status page stays current on its own, so it covers the real-time layer of reporting without you lifting a finger.
- Pull data through your monitoring tool's API or data export on a schedule. Drop the figures into your own report template or spreadsheet. If you've got a developer on the team, a small script can calculate availability for the period and populate the template.
- Use webhooks for incident events. Push them into your project management tool or a client Slack channel so incidents are logged and visible without manual copying.
- Build a simple monthly routine: export, validate, add commentary, send.
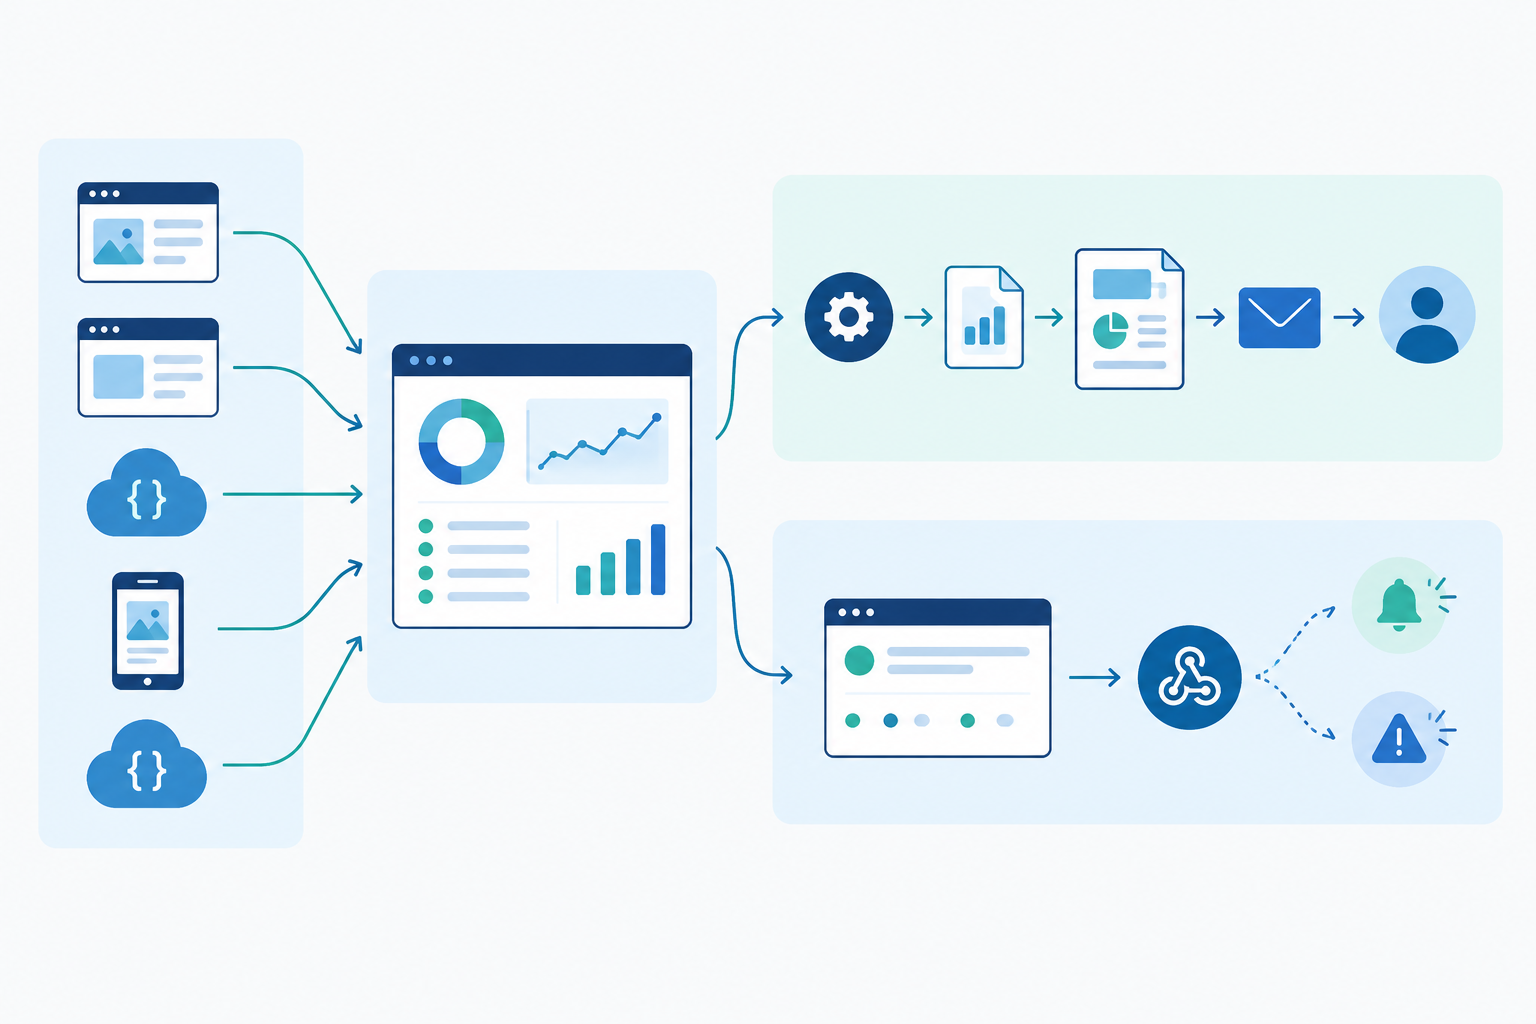
The minimum data to export for monthly client reports
Whatever tool you use, make sure each monthly export gives you at least:
- Monitor name and the client it belongs to
- Reporting period (start and end, with time zone)
- Availability percentage
- Response-time summary (average and peak, plus the check type)
- Incident list with start time, end time and duration
Check your tool's documentation for exactly what its API and export provide, as fields and limits vary. If something you need is missing, you'll want to know before you build your template around it.
What to automate and what to keep human
Automate the data collection and formatting. Keep the commentary and recommendations personal. That short paragraph saying 'here's what happened, here's what I'd suggest' is what clients value most, and a generic automated PDF can't replicate it.
One safeguard worth building in: check for missing or stale data before you send. If a data feed fails quietly, you can end up with a polished report that's misleading. A quick sanity check, such as confirming every monitor returned results for the full period, takes seconds.
I'd also pick tools that let you export your data in a standard format like CSV or JSON. That way, if your reporting workflow changes down the line, you can still take your history with you.
Using Uptime Reports to Justify Retainer Value and Win Upsells
The most effective reports are framed around outcomes rather than activity. Not 'we ran 43,000 checks', but 'we caught two issues before you did, and resolved both within minutes'. Problems prevented, issues caught early, fast response: that's the story.
Here's a hypothetical I find myself describing often. Imagine an agency that spots, through SSL certificate monitoring, that a client's certificate is due to expire in two weeks and the auto-renewal has quietly failed. They fix it before a single customer sees a browser warning. Or a nightly backup job stops sending its heartbeat, and the agency finds the cause before the client ever needs a restore. Saves like these can make a strong case for your retainer, though I wouldn't promise any particular outcome. They only count if the client knows it happened, and the report is how they find out.
The data also shows you where the natural upsell moments are:
- Slow response times suggest hosting or performance work.
- Repeated incidents on the same service make the case for infrastructure upgrades.
- Unmonitored APIs or scheduled jobs are gaps you can offer to cover.
- Approaching expiries open the door to managed renewals.
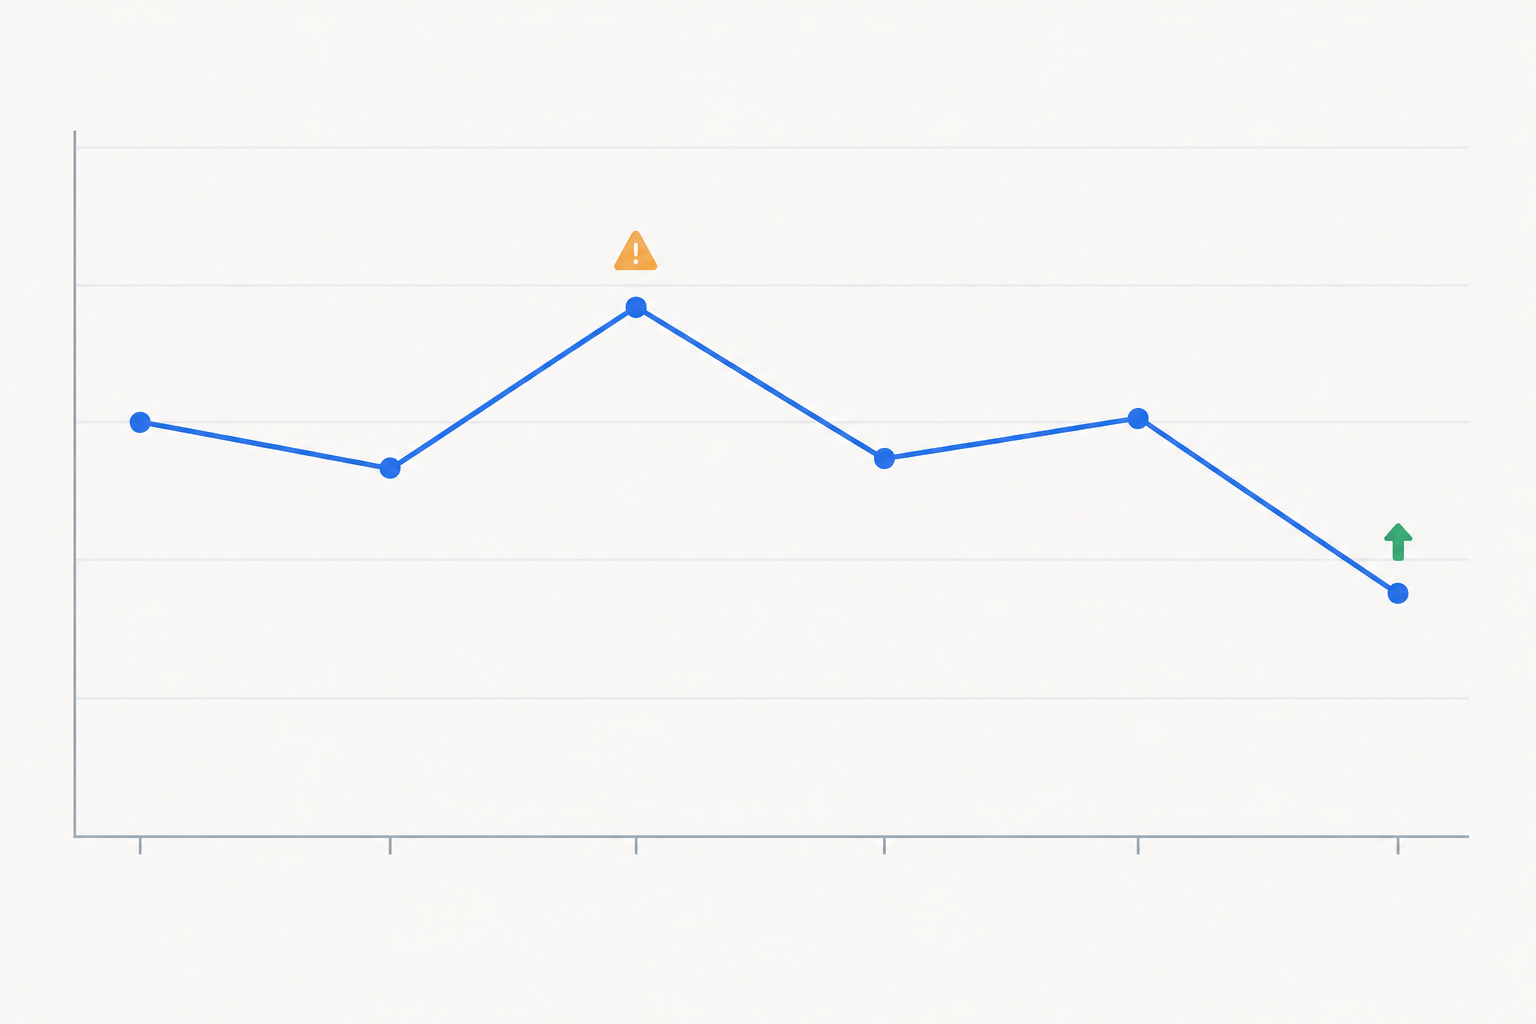
Use the report in quarterly business reviews as a conversation starter rather than a document dump. Put the trend chart on screen and ask, 'The monitored page has crept up by half a second since spring. Want me to look at what's behind that?' That feels like advice, not a pitch.
Finally, consider offering monitoring as a visible service with tiers. A basic tier might cover uptime and SSL with a monthly report. A premium tier could add API monitoring, cron checks, weekly summaries and faster response times. Clients who want more coverage can opt in, and a background task becomes something people can choose to buy. If you're pricing in pounds, state whether your fees include or exclude VAT so the line item is clear on the invoice.
Setting Up Multi-Client Uptime Monitoring Without the Overhead
You don't need a sprawling toolchain for this. A shared platform with clear grouping does the job. Here's what to think about:
- Pick the monitor types each client needs. Moonitor, the platform I use in examples here, offers eight types, covering HTTP/S, keyword, port and ping, SSL and domain expiry, cron/heartbeat and DNS record change detection. A brochure site might need three, while an API-driven product might use most of them.
- Use multi-region verification to cut false alarms. It won't guarantee that every visitor experienced an outage, but it helps keep alerts and reports more trustworthy.
- Match plan size to agency growth. Count how many monitors your client roster really needs, then choose a plan that leaves some headroom.
- Fold the cost into the retainer. List monitoring and reporting as a line item so the service is visible on the invoice.
- Pilot it with one or two clients first. Test your report format on a small group before rolling it out.
- Keep each client's data separate. Share only that client's monitors, and use a dedicated status page for each so one client never sees another's information.
Example pricing (check before you buy)
At the time of writing, Moonitor lists a Solo plan at $14/month for 20 monitors and a Max plan at $49/month for unlimited monitors, and offers a 7-day free trial with no credit card required. These prices are in US dollars, so UK agencies should check the current figure in their billing currency, along with any VAT, before budgeting. Plans, limits and trial terms change, so confirm them on the provider's pricing page rather than relying on this guide.
FAQ: Client Uptime Reporting
What uptime metrics should I share with clients?
Start with uptime percentage, a short incident history with causes and resolutions, response-time trends, and SSL and domain expiry dates. Add cron or heartbeat results if the client relies on scheduled jobs. Keep the language plain, state how you measure, and focus on what the numbers mean for their business.
How often should I send monitoring reports to clients?
Monthly works well for most retainers, with a quarterly review to discuss trends and next steps. High-stakes clients such as online shops may appreciate weekly summaries or a message after each significant incident.
Can I automate client reporting?
Largely, yes. Pull availability, response-time and incident data through an API or export into your own template, and let a status page cover live visibility. Check the data for gaps before sending, and add a short personal summary. That's the part clients value most.
How do reports help retain clients?
They make invisible work visible. A regular record of uptime, incidents resolved and risks avoided gives clients a concrete reason to renew, and it gives you natural openings to suggest extra services based on real data.
Should I share a public status page with every client?
Not necessarily. It suits clients with customer-facing sites or APIs where transparency builds trust. For smaller brochure sites, a monthly report may be enough, and you can add a status page later if the client asks.
Wrapping Up: Make Client Uptime Reporting Work for Your Agency
Client reporting doesn't have to be a chore. Keep it short, keep it visual, be honest about how the numbers are measured, and keep it about outcomes. Pair a monthly summary with a branded status page, automate the data gathering, and save your own time for the commentary that makes the difference. If you'd like to try it, pick one or two clients, run a trial of your monitoring tool, and send your first report next month. You might be surprised how quickly 'what are we paying for?' turns into 'can you do more of that?' 🙂