
Client Reporting Made Easy with Response-Time Analytics: A Practical Guide for Agencies
Learn how agencies can turn response-time analytics into clear, client-ready reports that build trust, support SLA talks, and save hours every month.
Response-Time Analytics for Client Reporting: A Practical Guide for UK Agencies
A practical guide to turning raw monitoring data into client-ready reports with response-time analytics—without adding hours to your monthly workload.
If you're managing monitoring for a dozen client websites and APIs, you already know the worst part of the month isn't fixing incidents—it's writing about them. Pulling raw uptime logs into a spreadsheet, trying to make sense of timestamps, and hoping the client doesn't ask a question you can't answer in thirty seconds can quickly become a time-consuming task. There's a better way, and it's more straightforward than you might think.
The fastest way to make client reporting painless is to stop sending raw logs and start sending a short, visual summary built from response-time analytics: average and peak response time, uptime percentage, incident count, and one or two trend charts. Pair that with an automated reporting schedule and a branded status page, and a monthly chore becomes something that genuinely helps justify your agency retainer. The shift is simple to describe, even if it takes a bit of setup to get right: less data dump, more story.
Let's walk through how to build that habit into your agency's workflow without adding hours to your week. Along the way, we'll flag where the terminology gets fuzzy, because getting it right matters when a client starts asking pointed questions.
Why Clients Care About Performance Data
Here's something I've noticed working with agencies: clients almost never ask, “Is my site up?” What they actually want to know is closer to, “Is my site fast enough that I'm not losing customers?” Uptime is table stakes. Speed and consistency are what clients associate with a smoothly running business.
It's worth pausing on a distinction that gets glossed over a lot: the response time your monitoring tool reports is a synthetic measurement. It measures how long a single monitored request takes to complete from a specific checkpoint. That's genuinely useful, but it isn't the same thing as page load time as a real visitor experiences it. It also isn't the same as Core Web Vitals or real-user monitoring data, which capture what's happening in actual browsers across different devices and connections.
If a client asks why their reported response time doesn't match what they're seeing in Google's PageSpeed Insights tool, this is usually why. Both numbers matter, but they're answering different questions. Clear client reporting should explain that distinction rather than presenting synthetic response-time analytics as a complete measure of user experience.
With that caveat in mind, the underlying point still holds: a site can be technically “up” 99.9% of the time while still feeling sluggish to visitors. Slow, inconsistent response times can contribute to a poorer user experience and, over time, weaker conversion performance—although the exact relationship depends on the site, the audience, and what “slow” means for that business. It's rarely as clean as “X milliseconds equals Y lost sales”, but it's also not nothing, and most clients don't have the tools to see it happening on their own.
This is where you come in. When you proactively share performance data instead of waiting for something to break, you position your agency as the team keeping an eye on things around the clock—not just the team that shows up when something's on fire. That shift in perception matters. It's the difference between being seen as a line item and being seen as infrastructure the client relies on.
Regular client reporting also tends to head off a familiar conversation before it starts: the “What am I actually paying you for?” question. A clean monthly summary showing verified uptime, response times, and a couple of resolved incidents usually answers that on its own.
What Performance Metrics Should You Include in Client Reports?
Not all data belongs in a client-facing report—some of it should stay on your internal dashboard. It helps to think about metrics in three tiers: what clients need to see, what's useful as supporting detail, and what's genuinely optional depending on the client.
Essential Client Reporting Metrics
- Uptime percentage over the reporting period, with the denominator made explicit—for example, “based on checks every 60 seconds across the calendar month, excluding one scheduled 20-minute maintenance window.” Monthly is the standard cadence for most UK agency retainers; stick with that rhythm unless a client specifically wants weekly reporting.
- Average and median (p50) response time, ideally alongside a 95th-percentile figure. Averages can be misleading: a handful of extreme delays can drag a mean upward and make performance look worse than it typically is, whilst hiding the experience of most visitors. The median gives you the “typical” experience; the 95th percentile flags the slow outliers worth investigating.
- Incident count, duration and root cause where known. Clients don't need a play-by-play, but they do want to know that something happened, roughly how long it lasted—measured from confirmed alert to confirmed resolution—and whether it has been addressed.
Useful Supporting Performance Data
- Response time broken down by region, if the client has an international audience. A UK-only average can hide the fact that visitors in, say, the US or Asia-Pacific are experiencing real delays—particularly relevant if the site is hosted on UK or EU infrastructure.
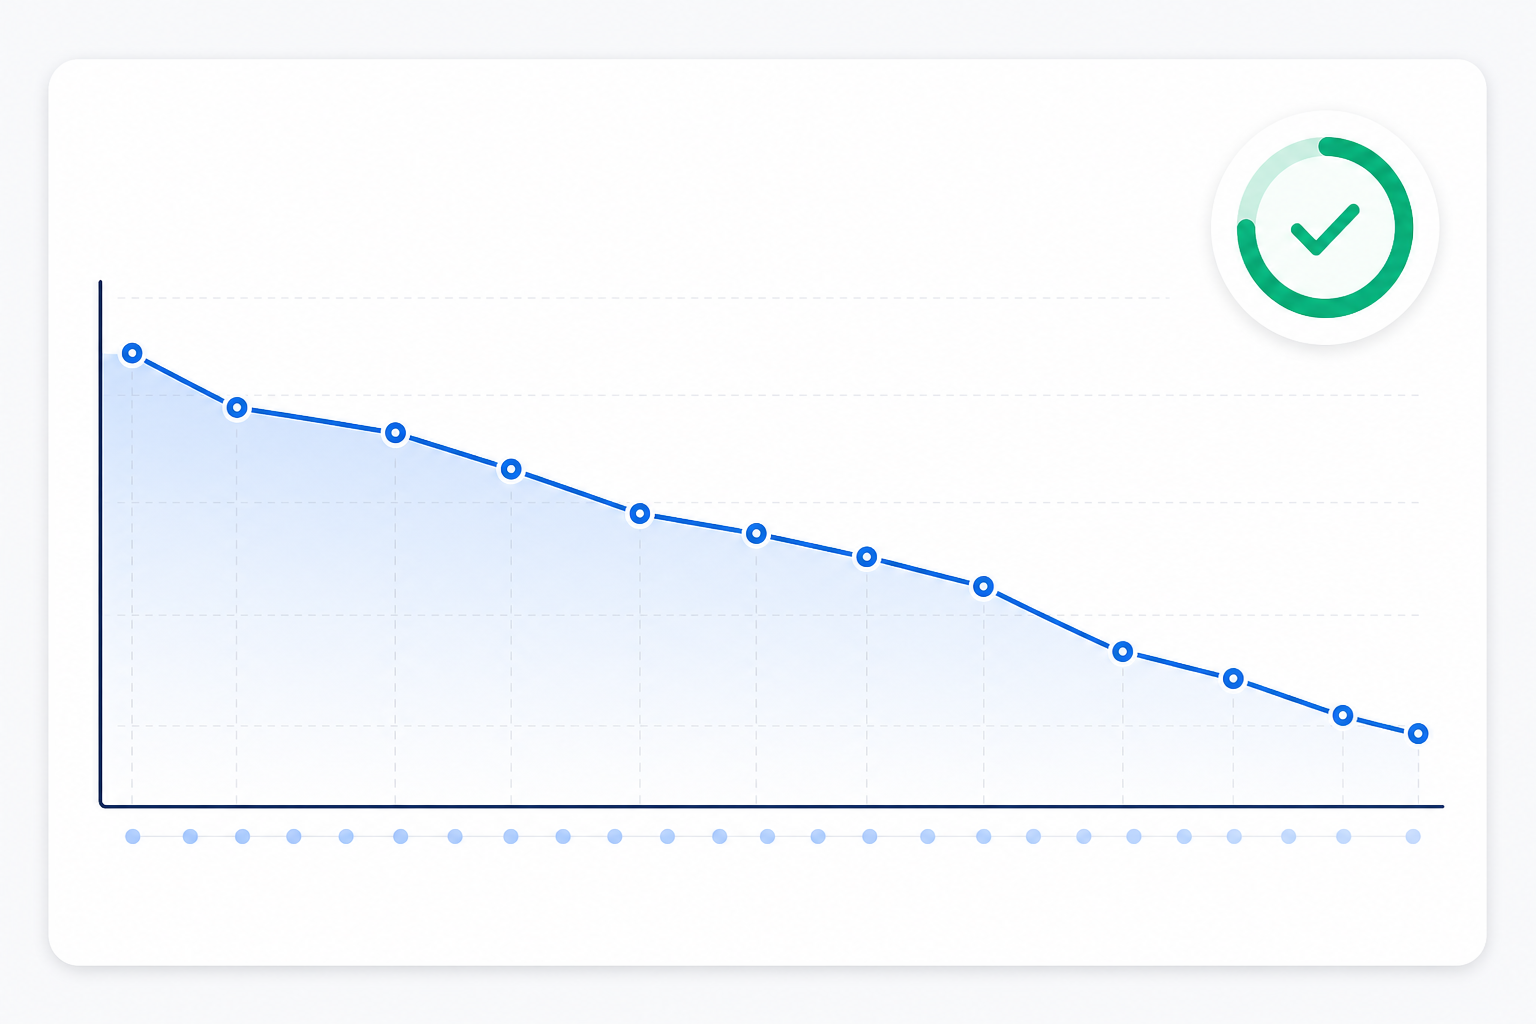
- A short trend line comparing this month to last, so improvements or regressions are obvious at a glance rather than buried in a table.
Optional or Internal Monitoring Metrics
- SSL certificate and domain expiry status. Minor in isolation, but clients genuinely appreciate seeing it tracked. Nobody wants to learn their certificate has lapsed from an angry customer email instead of their agency.
- Cron job and scheduled task health, especially for clients relying on background processes such as nightly syncs, billing runs or automated exports. Flag this to the client only if it's relevant to their operations; otherwise, it can live in your internal notes.
None of this data means much without an agreed baseline. Before your first report goes out, confirm with the client—or document internally—what monitoring interval you're using, how maintenance windows are excluded from uptime calculations and what counts as an “incident” rather than a blip. That groundwork makes every report that follows far more defensible.
Turning Raw Response-Time Data into Client-Friendly Summaries
Most clients don't want a spreadsheet full of timestamps. They want a few sentences and a chart they can understand in ten seconds.
Start every report with the headline number: uptime percentage and average or median response time—before any supporting detail. If someone only reads the first line of your email, that line should tell them what they need to know:
Your site was available 99.97% of the time this month, with a typical response time of 340ms and a 95th-percentile response time of 890ms.
Clean, specific and useful.
From there, swap jargon for plain language wherever you can. Instead of “multi-region check failure triggered escalation”, try:
We confirmed the outage from three separate locations before sending an alert, so you know it reflects a genuine issue rather than a one-off connection blip.
That sentence explains your process and reassures the client that you're not crying wolf over noise.
A quick word on what multi-region verification actually proves, because it's easy to overstate: checking from several locations before raising an alert significantly reduces false positives caused by a single unreliable connection on your monitoring provider's end. It does not guarantee that every visitor, everywhere, experienced the same outage. A regional ISP issue or a CDN edge problem can still affect some users without showing up across all your check locations.
What multi-region monitoring does provide is a defensible, repeatable rule for what counts as “confirmed downtime” in your reports. That's exactly what you want when a client starts comparing months.
Here's what a short, finished client summary might look like at the top of a monthly report:
August summary for [Client Site]
Uptime: 99.98% (target: 99.9%). Typical response time: 310ms; 95th percentile: 720ms—both improved slightly on July.
One incident: a 12-minute outage on the 14th, confirmed across three regions, caused by an upstream DNS provider issue and resolved without action needed on your end.
No SSL or domain renewals due this month. Recommendation: no changes needed; we'll keep monitoring the DNS provider's status page given last month's incident.
That's five lines, and it covers the headline, the trend, the incident explanation and a forward-looking note—which is usually all a client actually reads.
A branded public status page does a lot of the remaining work. Instead of waiting for your monthly email, clients can check in at any time and see a live view of uptime, current status and recent history. It's reassuring for them, and it takes the pressure off you to answer the “Is everything okay?” message on a Friday evening.
How to Automate Recurring Client Reports
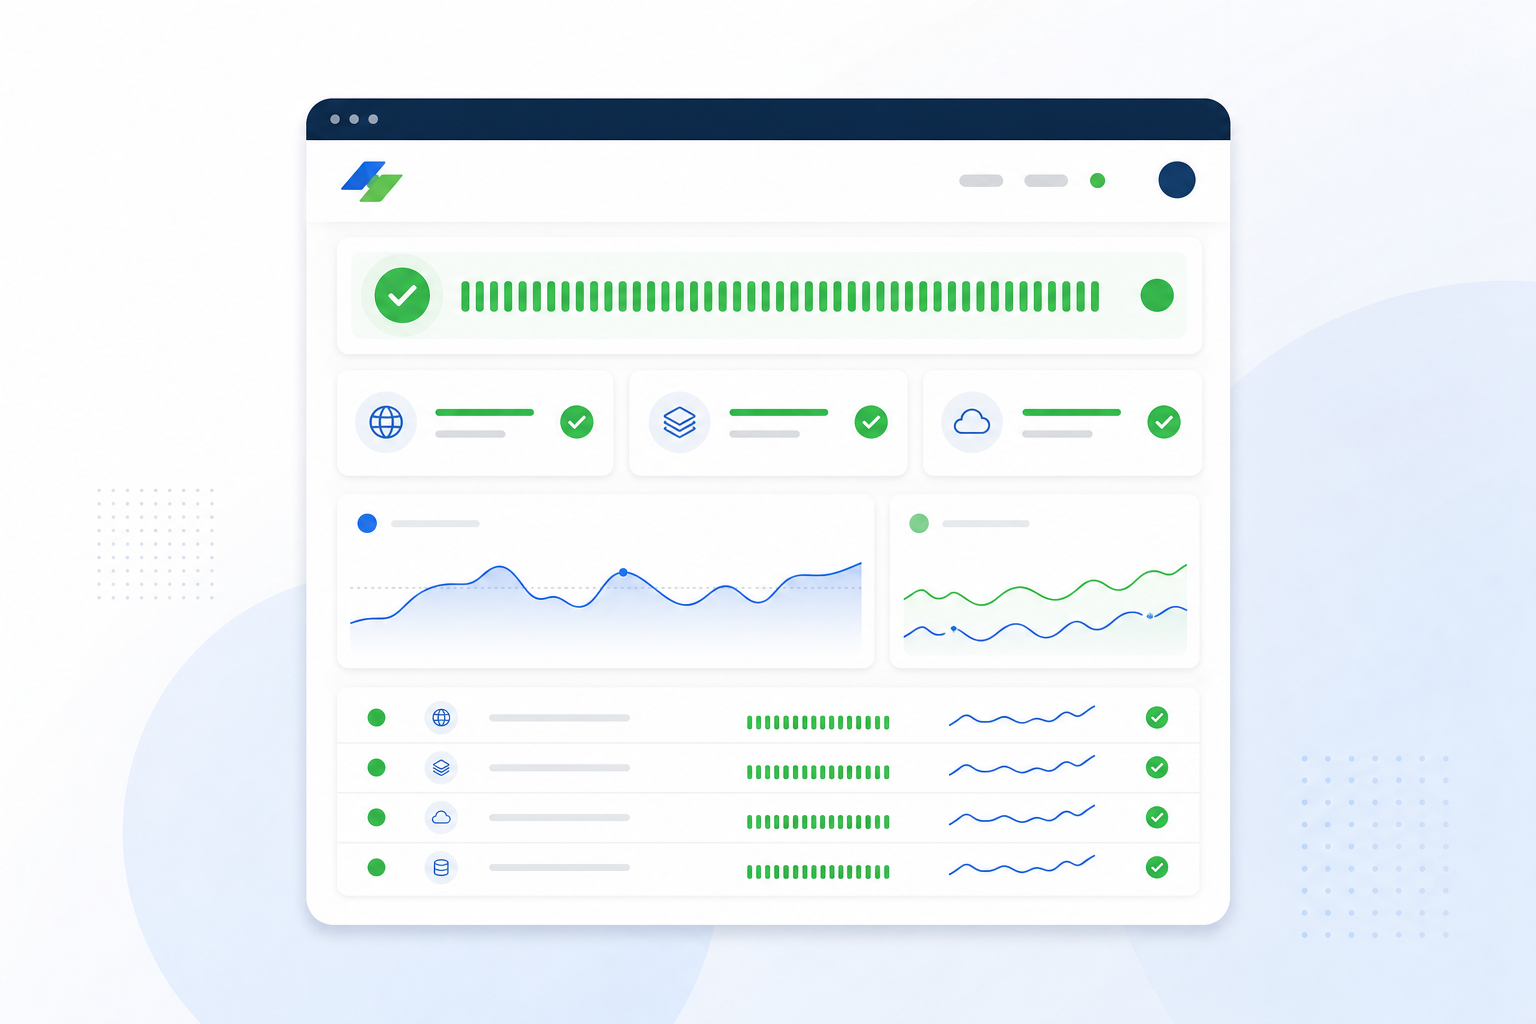
Manually assembling reports every month is exactly the kind of task that quietly eats agency hours until someone notices. Here's a repeatable system, including the quality checks that keep it from becoming “automated but unreliable”:
- Centralise your monitors. Bring each client's website, API endpoints and critical cron jobs into one dashboard rather than juggling separate tools for each client. Whatever platform you use, look for coverage across the check types you actually rely on—HTTP/S, keyword matching, port and ping, SSL, cron or heartbeat and DNS—so you're not stitching together data from five different services by hand.
- Build a reusable report template. Use your response-time analytics and incident history to create one format that you can apply across every client account, adjusting only the client-specific numbers and notes.
- Add a data freeze and review step. Before a report goes out, freeze the numbers for that period and have someone review anything that looks unusual: a suspicious spike, a missing data point or a check that silently stopped running. This takes a few minutes and catches errors that automation alone won't.
- Pull data via API or export when a client needs custom branding or a different reporting cadence. Full data export matters here too: you're never locked into one format or one platform's quirks, which is important if you ever need to switch tools or hand a client their historical data.
- Schedule delivery on a consistent day. Many UK agencies default to the first working day of the month or align delivery with existing client check-ins, so reports go out automatically rather than depending on someone remembering.
- Set up a failed-export alert. If a scheduled report doesn't generate or send, you want to know before the client does. A missed report is worse than a slightly late one.
- Keep a status page link handy for clients who want real-time visibility between scheduled reports. It reduces ad-hoc check-in messages and gives clients a sense of control.
Once this is set up, adding a new client to your reporting workflow becomes far cheaper in time and effort. You're not building a new process each time—you're plugging another monitor into a system that already works, with the review step making sure “automated” doesn't quietly slide into “unchecked”.
Using Response-Time Analytics to Support SLA Discussions
This is where response-time analytics stop being a nice-to-have and become a genuine business asset. Historical uptime and response-time data turn SLA renewal conversations from opinion-based debates into evidence-based discussions. Instead of “I feel like things have been slower lately”, you're working from actual numbers—as long as those numbers are measured consistently.
It's worth separating two things that often get blurred together: availability SLAs—what percentage of the time the site was reachable and responding—and performance SLAs—how quickly it responded when it was up. They're measured differently, can move independently of each other and require different reporting approaches.
A site can hit 100% availability while still breaching a response-time target, and vice versa. Client reporting is much more useful when you're clear about which type of SLA you're discussing.
How to Make Response-Time Data Credible
Verified incident history matters. If your alerting flags confirmed outages rather than false alarms from a single unreliable check, your numbers hold up under scrutiny. As covered above, multi-region verification reduces—but does not eliminate—false positives. Document your confirmation rule, such as “downtime is logged only when two of three regions fail consecutively”, and apply it consistently so clients know exactly how your numbers are calculated.
Percentiles beat averages for performance SLA conversations. If 95% of requests were handled within target but the remaining 5% took several seconds, an average can mask that entirely. Reporting median and 95th-percentile response times alongside your SLA target gives a more honest and defensible picture.
This mirrors the approach used in formal SLA frameworks, where an availability target of 99.9% monthly uptime translates to roughly 43 minutes of allowed downtime per month, compared with roughly four minutes at 99.99%. Small percentage shifts represent meaningfully different operational commitments. Clients respond well when you translate an abstract percentage into something concrete.
Trends beat snapshots. A single good month doesn't prove much, but three to six consistent months of verified uptime and response times is often the strongest argument you'll have when a client is deciding whether to renew at a higher tier or push back on your rate. It's hard to argue with a clean, consistent trend line—although it's worth being upfront if a bad month is in there too. Clients tend to trust reporting more, not less, when it includes the occasional rough patch alongside the good ones.
How to Present Reports Without Overwhelming Clients
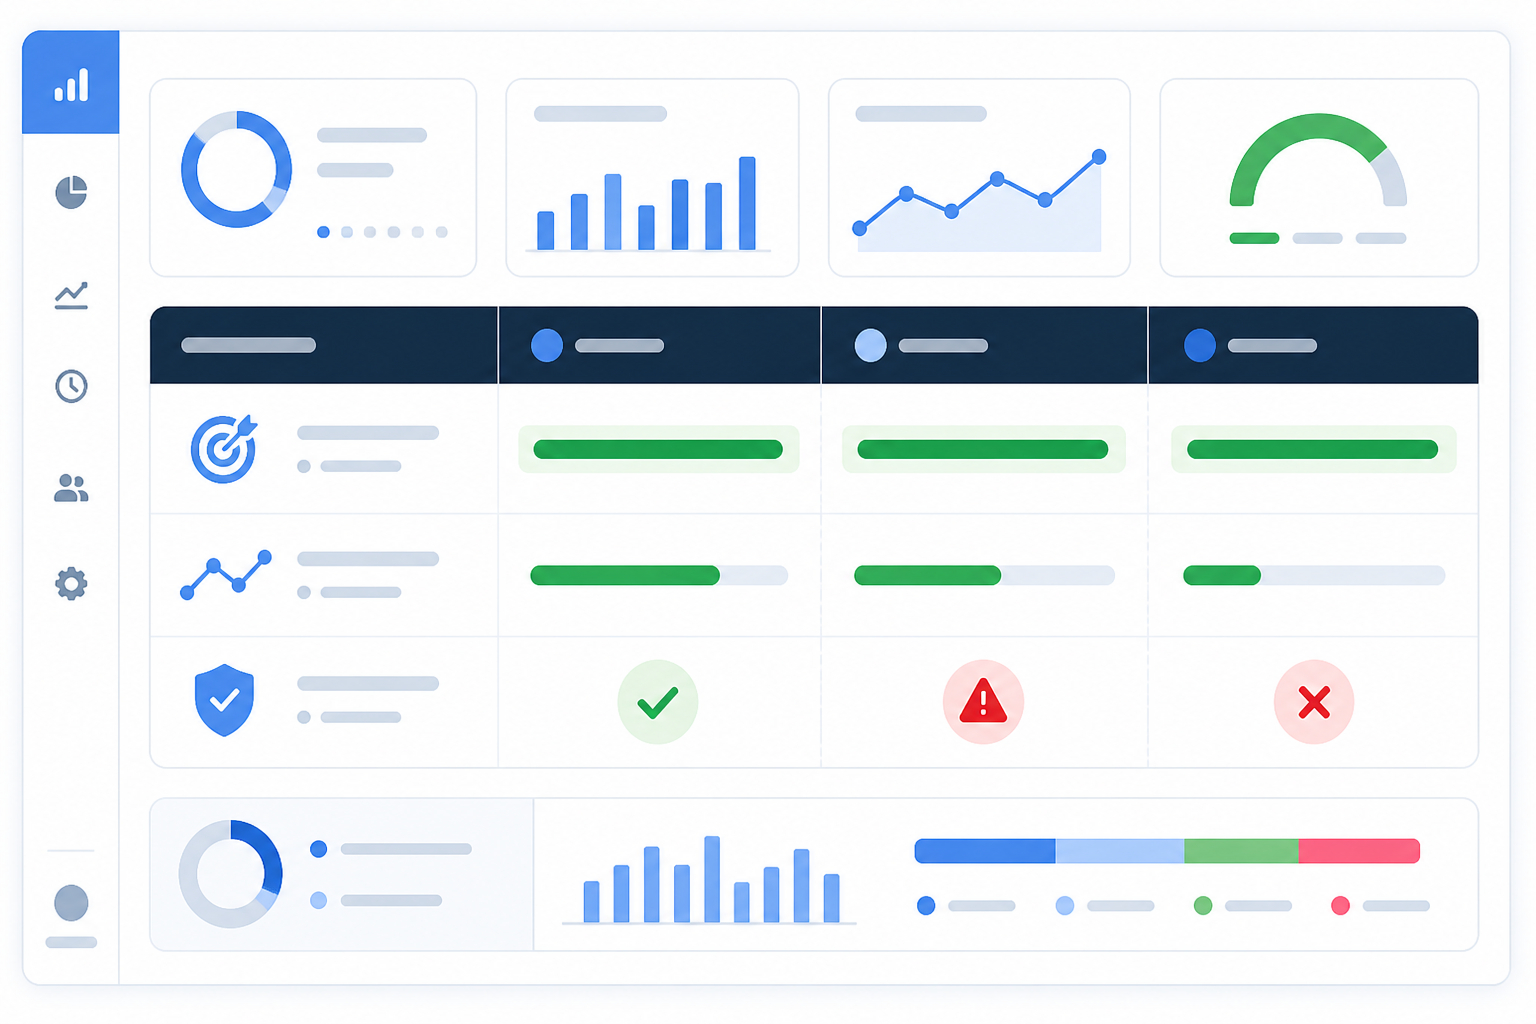
All this data is only useful if the client actually reads it. A few habits go a long way:
- Pick one headline metric per report. Don't bury the important number under ten charts. Lead with it, then support it below.
- Default to a one-page layout. Include a headline summary at the top—two or three sentences—a single trend chart, incident notes if any occurred and a short “what we're watching” line. Save detailed regional breakdowns, percentile tables and raw logs for an appendix or linked dashboard.
- Match detail to the client's technical comfort. A technical client might genuinely want response-time percentiles and regional breakdowns front and centre. A non-technical client mostly wants “everything's running smoothly” with a clear visual indicator. Include the deeper detail either way; just decide where it sits on the page.
- Keep your cadence consistent. Clients relax when they know exactly what to expect and when—the first working day of the month, always, with no surprises.
- Offer the status page as the “always-on” option. Reserve full written reports for monthly or quarterly check-ins. This gives clients real-time confidence without requiring you to send updates constantly.
Getting this balance right is what separates a report clients skim from one they actually read and remember. It's worth revisiting the format every few months as a client relationship matures.
A Quick Note on Data and Hosting Location
One UK-specific wrinkle worth flagging: if you're monitoring from checkpoints outside the UK or EU, or storing client performance data with a provider based elsewhere, it's worth checking where that data physically sits and how it's handled—particularly if any of it could be considered personal data under UK GDPR.
Most monitoring and status-page data is operational rather than personal, but it's a five-minute check worth doing once per platform rather than assuming.
Frequently Asked Questions About Client Reporting and Response-Time Analytics
What performance metrics should I include in client reports?
At minimum, include uptime percentage—with the monitoring interval and any excluded maintenance windows stated—median and 95th-percentile response time, and incident count with duration. If the client has an international audience, add regional response-time breakdowns. SSL and domain expiry status are small additions that make reports feel thorough without much extra work.
Keep in mind that response time here refers to a synthetic, monitored measurement. It is not the same as real-user page load speed, which requires separate tools if a client specifically asks about it.
What's the difference between uptime and response time, and why do I need both?
Uptime tells you whether the site was reachable and responding at all during a check; response time tells you how quickly it responded when it was up. A site can be 100% “up” while still being frustratingly slow, which is why reporting uptime alone can flatter performance that clients are actually unhappy with.
Reporting both metrics—ideally with a percentile figure rather than just an average—gives a much more complete picture.
How can I automate uptime reporting for multiple clients?
Centralise all client monitors—websites, APIs, cron jobs and SSL checks—in one dashboard, then use scheduled exports or API access to generate reports automatically. Add a brief manual review step before each report goes out to catch anything automation alone would miss, such as a monitor that silently stopped reporting.
This removes the manual spreadsheet-building step that eats up agency time every month without removing the human check that keeps the data trustworthy.
How do I use response-time data to support SLA conversations?
Bring historical trends, not just a single snapshot, and be clear about whether you're discussing an availability SLA or a performance SLA—they're measured differently. Verified incident history, confirmed across multiple regions to reduce false alarms and supported by a documented confirmation rule, gives you solid evidence when discussing SLA compliance, renewals or a support-tier upgrade.
Percentile figures, rather than averages alone, make the strongest case because they show both the typical experience and the slower outliers.
Client reporting doesn't have to be the part of the month you dread. It does, however, need a bit of upfront thinking about what you're measuring, how you're measuring it and what counts as an incident. Automation and templates only pay off once that groundwork is in place.
Get that right, and once your monitoring, response-time analytics and status pages are working together, most of each report is genuinely just filling in the client-specific notes on top of a structure that already works. That's a fair trade for one of the clearest ways you have to show clients exactly what they're paying for.