
How Agencies Can Centralize Monitoring for Dozens of Client Sites
How Agencies Can Centralize Monitoring for Dozens of Client Sites: unify alerts, uptime reports, and status pages to save time and reduce churn.
If you're running an agency with even a dozen client sites, you already know the drill. One client's on Pingdom. Another's on UptimeRobot because that's what the last developer set up. A third client? You're manually checking their site every morning with your coffee because nobody got round to setting up anything at all. Sound familiar?
This guide to How Agencies Can Centralize Monitoring for Dozens of Client Sites covers the practical way to consolidate fragmented tools without losing coverage or overwhelming your team.
The short answer is to consolidate everything into a single website monitoring platform, organised by tags or workspaces for each client, with alert routing that sends the right notification to the right person. Add branded status pages so clients can check their own uptime without contacting you, and you've got the foundations of a proper agency monitoring setup.
As one example of what this looks like in practice, platforms like Moonitor are built around this exact workflow, monitoring HTTP, SSL, cron jobs and DNS from one dashboard instead of across a dozen logins you half-remember the passwords to. I'll reference it a few times below, but the principles here apply whichever platform you choose, so treat it as an illustration rather than a recommendation to buy anything specific.
Let's look at why fragmented monitoring is quietly costing you more than you think, and how UK agencies can centralise client site monitoring without creating a new mess in the process.
Why fragmented client monitoring creates problems
Here's a scenario I hear constantly from agency owners: you're managing 15 client websites, and your monitoring setup looks like a patchwork quilt. One client insisted on their own Pingdom account years ago. Another client's "monitoring" is a sticky note reminder to check their SSL certificate before it expires. A third is tracked in a shared spreadsheet that someone updates... occasionally.
This isn't a hypothetical. It's the default state for a lot of agencies, and it creates real blind spots. When nobody owns the full picture, things fall through the cracks - not because your team is careless, but because the system itself is broken. Picture this: a cron job that's supposed to run a nightly backup quietly fails for three weeks. Nobody notices until a client needs to restore from backup and discovers there isn't one. That's not a dramatic story; it's an ordinary Tuesday for a lot of agencies.
There's also a hidden cost that rarely makes it into anyone's time-tracking software: context-switching between dashboards. Say you're checking five different tools every morning, each with its own login and its own way of displaying data. If that takes even 20 minutes a day across a team of three, you're looking at roughly 25 hours a month spent just looking for problems rather than solving them. That's time that could be billable work instead.
And then there's the scenario that actually threatens client relationships: the outage nobody caught. A client's homepage goes down for two hours on a Saturday, and the first you hear about it is an angry email on Monday morning asking why you didn't notice. That's not just embarrassing; it erodes trust fast, and trust is essentially the entire product an agency sells. Client churn rarely happens because of one big dramatic failure. It happens because of a slow accumulation of "you should have caught that" moments.
For UK agencies specifically, there's an added wrinkle: if your monitoring tool checks only from US-based servers, you may get false confidence about how your site actually performs for UK and European visitors. Checking from a UK or EU region matters if that's where most of your clients' traffic comes from.
What are the benefits of a centralized monitoring dashboard?
So what actually changes when you move everything into one website monitoring platform? Here's what agencies typically notice first - and, just as important, what has to be true first for each benefit to actually show up:
- One login, one view. Every client's websites, APIs and servers show up in a single dashboard. This only pays off if you actually decommission the old tools, though. Keeping five accounts "just in case" defeats the point.
- Faster incident response. When something breaks, your team sees it immediately instead of hunting through five inboxes - but only if alert routing is set up correctly. Centralising monitors without centralising alerts just moves the chaos somewhere else.
- Faster client onboarding. Adding a new client's monitoring can take under a minute instead of requiring a whole new tool every time you land an account, provided you've already built a tagging convention.
- Fewer false alarms. Multi-region verification, which checks an outage from several locations before alerting anyone, matters enormously at scale. A single flaky network blip in one region can otherwise trigger unnecessary panic across your whole client list. Check that any platform you choose actually supports this before relying on it.
- Portfolio-wide analytics. Response-time data across every client in one view helps you spot patterns - say, which client's hosting is quietly degrading and might need an infrastructure conversation before it becomes an outage.
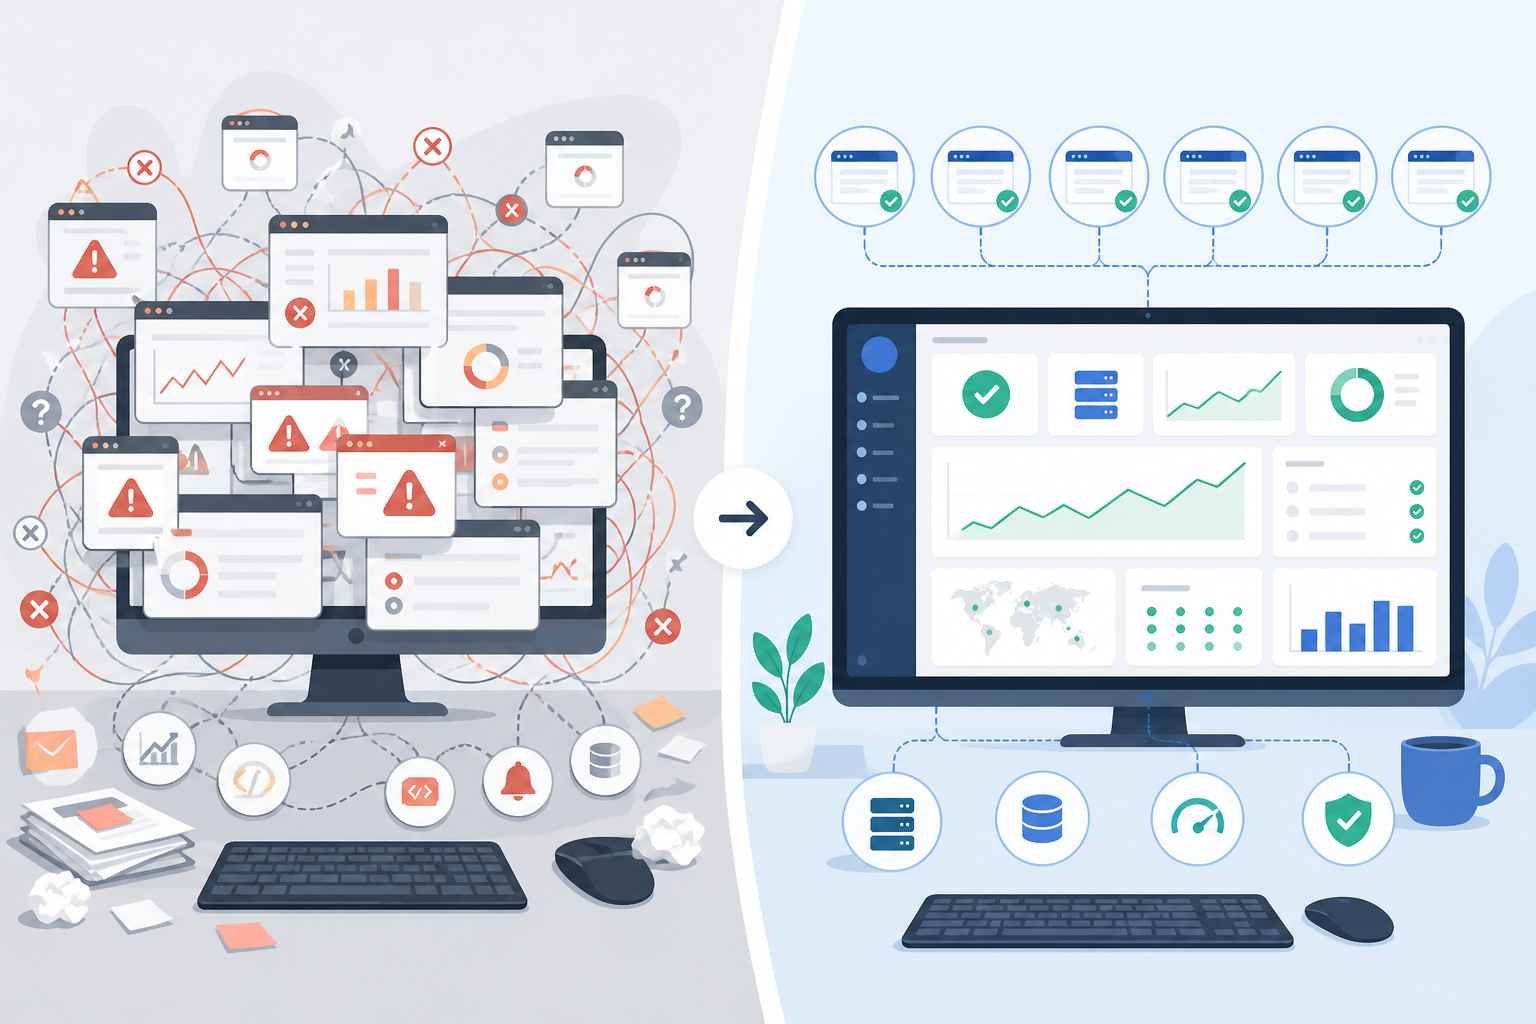
The real win isn't convenience, although convenience matters too. Centralising monitoring turns a reactive process into a proactive one. You stop finding out about problems from clients and start finding out from your dashboard, usually well before the client notices anything at all.
How Agencies Can Centralize Monitoring for Dozens of Client Sites
Knowing centralisation is a good idea is one thing. Actually migrating 40 client sites from five different tools without dropping anything is another. Here's a sequence that works well in practice:
- Inventory everything first. Before you touch a single setting, list every client, every existing monitor, who currently gets alerted, and what tool it lives in. A simple spreadsheet is fine. You can't migrate what you haven't counted.
- Map owners and service levels. For each client, note who on your team is responsible if something breaks, and whether that client's contract includes any particular response expectation. This becomes your alert-routing map later.
- Agree your naming and tagging convention before creating a single monitor. Retrofitting tags onto 200 monitors later is miserable. Get this right on day one - see the taxonomy below.
- Recreate critical monitors first, not everything at once. Start with your highest-value clients' core services - homepage, checkout, login - then work outwards to secondary checks.
- Run old and new systems in parallel for two to three weeks. Don't switch off Pingdom the day you set up the new dashboard. Overlap gives you confidence that the new alerts are firing correctly before you rely on them exclusively.
- Decommission the old tools deliberately. Cancel subscriptions, remove old integrations, and update any documentation or client-facing materials that still reference the old setup.
For a 30-site agency, this whole process typically takes two to four weeks of part-time effort, not a weekend sprint. Rushing the parallel-running step is the most common way agencies end up with a gap in coverage.
How should agencies organize monitors by client?
Once you've got everything in one place, the next challenge is keeping it organised as you scale. Twenty monitors are manageable with almost no structure. A hundred and twenty? You need a system, or you'll recreate the same chaos inside one tool instead of five.
A taxonomy that works well for most agencies follows this pattern: Client / Environment / Service / Severity. For example:
AcmeLtd / Production / Homepage / CriticalAcmeLtd / Production / API / CriticalNorthStarCafe / Production / Checkout-Keyword / High
This sounds fiddly at the start, but it means anyone on your team can search "AcmeLtd" and see every single thing being monitored for that client instantly.
Beyond naming, here's a practical approach to what you're actually monitoring:
- Group monitor types logically per client. Set up HTTP/S checks for the main site, keyword monitoring for pages where specific content must appear (checkout pages, login forms), port and ping checks for servers you manage directly, and SSL certificate monitoring for every domain in the client's portfolio.
- Add cron job and heartbeat monitoring for scheduled tasks. If a client has nightly backups, automated syncs or scheduled reports running behind the scenes, those need heartbeat monitoring too. The monitor expects a "check-in" signal on schedule and alerts you if it doesn't arrive. Without it, these are exactly the kind of silent failures that go unnoticed for weeks.
- Layer in DNS monitoring where it matters. For clients where a DNS change could signal something serious - a security compromise, an unauthorised migration, a domain transfer problem - DNS record change detection gives you an early warning.
- Review the monitor list quarterly. Client contracts change, sites get decommissioned, old subdomains stop mattering. Pruning old monitors keeps your dashboard clean and your alerts meaningful instead of noisy.
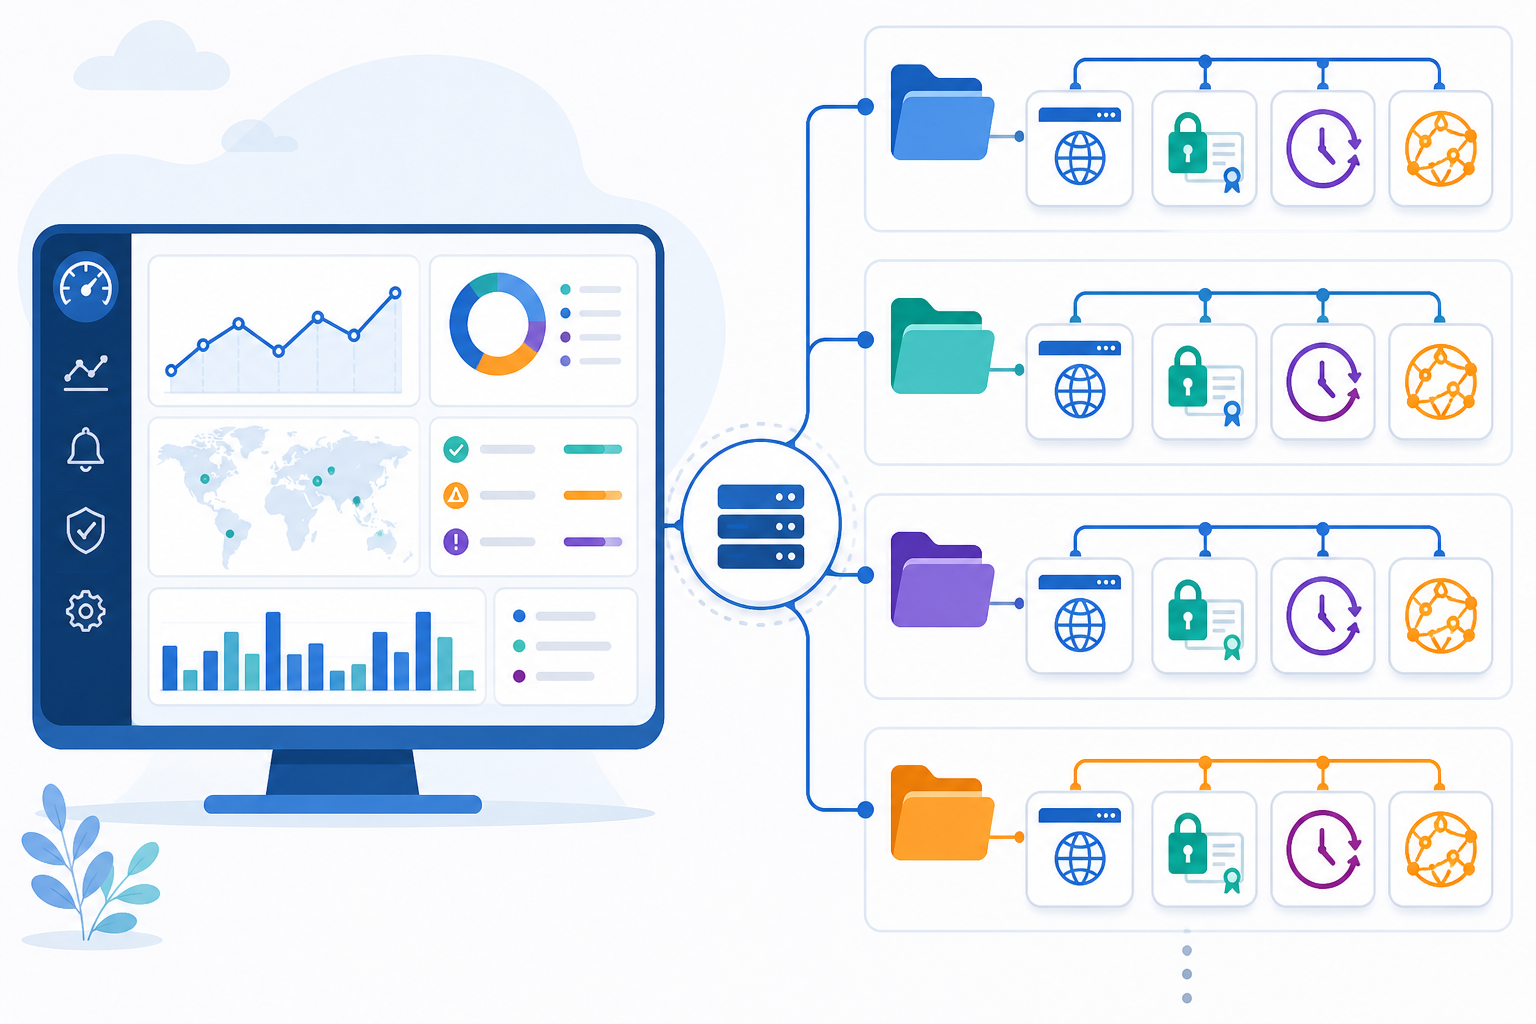
The tagging step feels tedious when you're setting up your tenth client in a single afternoon. But six months later, when you're troubleshooting at 2am and need to find every monitor tied to one account in seconds, you'll be glad you did it properly the first time.
How do you set up client-specific monitoring alerts?
This is where a lot of agencies get tripped up, even after they've centralised everything. Having all your monitors in one place is only half the job. If every alert dumps into one giant shared inbox, you've just traded five chaotic tools for one noisy one.
A few things make a real difference:
- Route alerts by client, not by platform. Each client's alerts should go to the person responsible for that account - an account manager, a specific developer, a dedicated support channel.
- Use dedicated channels per client or account manager. Whether that's Slack, Teams or whatever your agency already uses, the right person sees the right alert immediately instead of scrolling through a shared feed.
- Build escalation rules based on severity, not just downtime. A critical checkout page failing multi-region verification should page someone immediately, day or night. A non-critical marketing page failing the same check might only need a next-business-day ticket. A single blip that resolves itself within a minute shouldn't wake anyone up at 3am.
- Define maintenance windows properly. If a client's developer is deploying an update, pause alerts for that window rather than training your team to ignore "expected" downtime alerts. That habit is how real outages get missed.
- Tune check frequency by client tier, with caveats. Your highest-value retainer clients might warrant very frequent checks with aggressive alerting; smaller clients on lighter packages might be fine with checks every five minutes. Match monitoring intensity to what each contract calls for, while remembering that frequent checks can use up plan allowances faster.
- Pipe alerts into your own systems with webhooks, if your platform supports them. If you run a PSA tool or internal ticketing system, this lets every incident log automatically, so nothing depends on someone manually creating a ticket after the fact.
Getting alert routing right is where most of the long-term time savings actually live. It's the difference between your team feeling confident and in control, and your team quietly dreading another late-night ping that turns out to be nothing.
How can agencies report uptime to clients?
Here's the part that often gets overlooked but genuinely changes the client relationship: how you report on uptime matters almost as much as the monitoring itself.
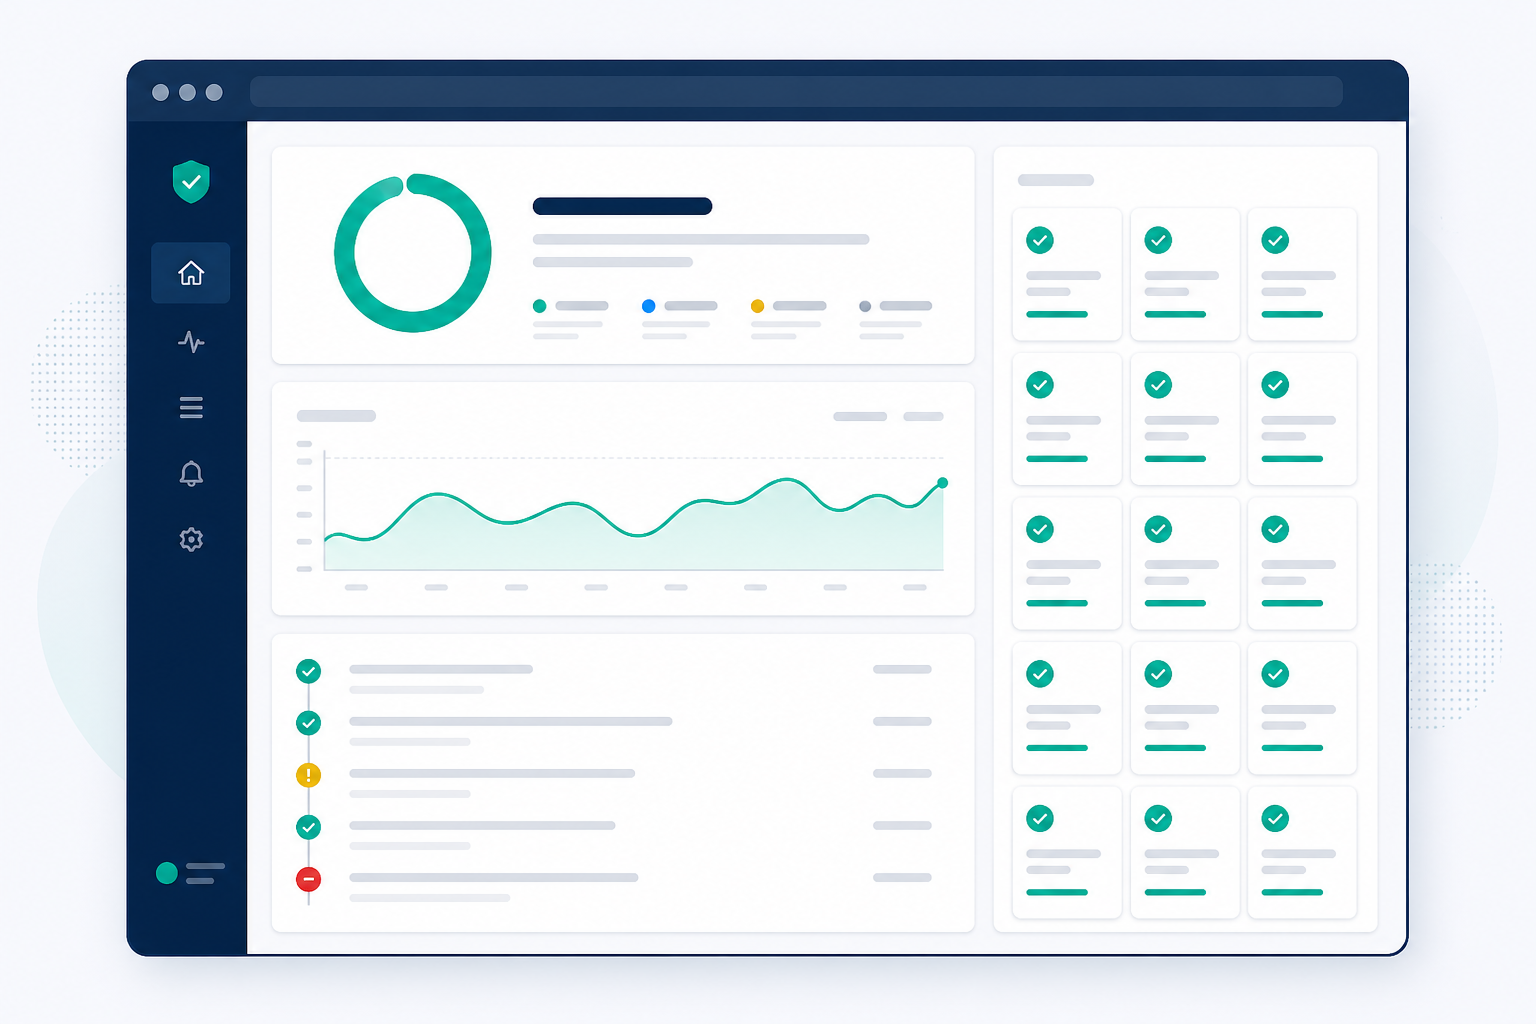
Branded public status pages are one of the biggest upgrades most agencies make once they centralise. Instead of manually compiling a monthly uptime report - or worse, not reporting at all until something goes wrong - each client gets their own view of their site's health. Once it's set up, it runs with no extra work on your end.
One word of caution worth building into your process: agree what "uptime" actually means before you show a client a percentage. Define the measurement window (monthly is common), note any planned maintenance exclusions, and make sure the figure lines up with the SLA language in their contract. A 99.9% figure means something different if it excludes agreed maintenance windows than if it doesn't.
Incident history adds another layer of trust. When something does go wrong, clients can see exactly what happened, when it was detected and how quickly your team resolved it. That transparency, somewhat counterintuitively, often builds more confidence than a perfect uptime record would. Clients don't expect zero problems; they expect to see problems handled well.
A simple monthly report can include the average uptime percentage for the period, the average response time and how it compares to the previous month, a short list of incidents with detection and resolution times, and one proactive note: "we caught this before you noticed." That's a far stronger conversation than a generic invoice with no context attached.
On the data side, if you're handling UK client data, it's worth checking where your monitoring provider stores and processes data and confirming it meets UK GDPR expectations. This matters particularly when deciding who has access to each client's data within your account. Role-based permissions, so a given team member only sees the clients they actually work on, are worth setting up properly rather than giving everyone admin access for convenience.
There's also a quieter benefit: fewer "is the site down?" emails. When clients can check a status page themselves at any time, a good number of those nervous one-line emails simply stop happening. If your platform offers API access and data export, you're also not locked into one reporting format - you can pull raw data into your own branded client reports if that suits your agency's workflow better.
Frequently asked questions about centralized client monitoring
How can agencies monitor many client sites efficiently?
Use one centralised monitoring platform with client-level tags or workspaces, standardised monitor templates, routed alerts and branded status pages. A single dashboard cuts down on context-switching, and a clear ownership model means every alert has someone responsible for actually responding to it.
How many client sites can one monitoring account realistically handle?
It depends on the plan and provider. Some tools, including higher-tier Moonitor plans at the time of writing, are built for agencies managing dozens or hundreds of sites from one account. Always check current plan documentation, since limits and pricing change. In practice, the real constraint is usually organisational: how well you tag and structure monitors matters more than the raw count.
Can each client get their own branded status page?
Most centralised platforms, Moonitor included, support individual branded status pages per client without exposing other clients' data on that page. Separately, check how the platform handles internal data separation and permissions within your own account. You generally want team members limited to the clients they work on, not blanket access to everyone's data.
What's the migration risk, and how do I avoid gaps in coverage?
The main risk is a coverage gap during the switchover - a monitor that existed in your old tool but was never recreated in the new one. Running old and new systems in parallel for a few weeks is the simplest safeguard. Keep your original inventory spreadsheet and check it off as each monitor is confirmed working in the new system.
How do I avoid alert overload across dozens of sites?
Multi-region failure verification is the feature to prioritise here. It confirms an outage from multiple locations before sending an alert, so a single region's network hiccup doesn't trigger a false alarm across your whole portfolio. Pair that with sensible retry logic, severity-based escalation and properly configured maintenance windows to keep the noise down.
Is it worth migrating from multiple free tools to one paid platform?
For agencies managing more than a handful of client sites, usually yes - though the payback period depends on your team's hourly rate and how much time you're currently losing to context-switching. Run the maths for your own agency rather than assuming. For many teams, the investment pays for itself within a few months once faster onboarding and fewer missed incidents are factored in.
Who should own monitor setup and alert routing within an agency?
Name one person - often an operations lead or senior developer - as the owner of the monitoring system itself, even if individual account managers own the client relationship. Without a named owner, tagging conventions drift and alert-routing rules quietly go stale as staff change.
What monitor types matter most for agency clients?
HTTP/S and keyword monitoring cover the basics for any website. SSL certificate monitoring helps you avoid embarrassing expired-certificate outages. Cron job and heartbeat monitoring matter for clients with scheduled backups or automated workflows, while DNS monitoring can catch unauthorised changes or migration issues before they turn into bigger problems.
Here's the thing about centralising monitoring: you're not really adding another tool to your stack. You're getting rid of several, and getting your time back in the process. Once everything lives in one dashboard, organised properly, with alerts going to the right person at the right moment and data handled responsibly, you stop firefighting and start managing your clients' infrastructure the way you always meant to.