
Website Uptime Monitoring for Agencies: A Practical Guide
Discover uptime monitoring for agencies: track client websites, APIs and SSLs, catch issues early, and prove maintenance retainer value with clear reports.

Uptime Monitoring for Agencies: A Practical Guide
The best uptime monitoring for agencies is centralised, low-noise and client-facing. You want one dashboard covering every client's websites, APIs, SSL certificates, domains and scheduled jobs, with alerts that reach you before the client notices. From that data you can build incident history, response-time reports and branded status pages. Done this way, website uptime monitoring stops being a hidden cost and becomes a visible part of your maintenance retainer.
That's the short version. Let's walk through how to actually do it, without turning it into a month-long project. ☕
Why uptime monitoring helps with client retention
Picture this. It's 8am, you're halfway through your first coffee, and your phone lights up. It's a client. "Hi, just checking, is our site meant to be showing an error?" It's been down since about 6.30. Their customers noticed. They noticed. You didn't.
The outage itself might be minor, perhaps a hosting hiccup or an expired certificate. The damage is to trust. The client doesn't think "things break sometimes". They think "I'm paying for maintenance and I'm the one doing the monitoring".
Proactive website uptime monitoring flips that. When you message them first, something like "we spotted a problem at 6.34, we're on it, here's the impact", you go from reactive firefighter to trusted partner. The incident is the same. The relationship isn't.
To be fair, monitoring alone doesn't cause retention. It's a service-quality tool. But spotting customer-facing problems and telling clients before they find out themselves is one of the most visible ways to show you're looking after their site.
The "nothing happened" problem
Here's the awkward truth about maintenance retainers. When you do the job well, nothing happens. No outages, no drama, no emergency calls. And at renewal time, a client looking at a monthly invoice for "nothing happening" can start to wonder what they're paying for.
Monitoring data makes quiet months visible. Thousands of checks run, certificates renewed on time, response times steady, two issues caught early. That's the evidence that the quiet was earned.
What downtime costs your clients
It helps to talk in client outcomes rather than server metrics: lost enquiries, abandoned checkouts, a dent in their reputation. A couple of numbers worth keeping in your back pocket:
- PwC's customer-experience research found 32% of consumers would stop doing business with a brand after one bad experience. That's about bad experiences generally rather than outages specifically, but it shows how little patience people have.
- Google's analysis of mobile landing pages found 53% of mobile visits were abandoned if a page took longer than three seconds to load. Slow isn't the same as down, but it hurts in a similar way.
So monitoring isn't overhead you absorb. It's a value-add that supports your retainer renewals.
What to monitor for each client website
Good news: you don't need every monitor type on every client. Start with the essentials and grow from there. Here's the menu, and Moonitor covers all of it from a single dashboard.
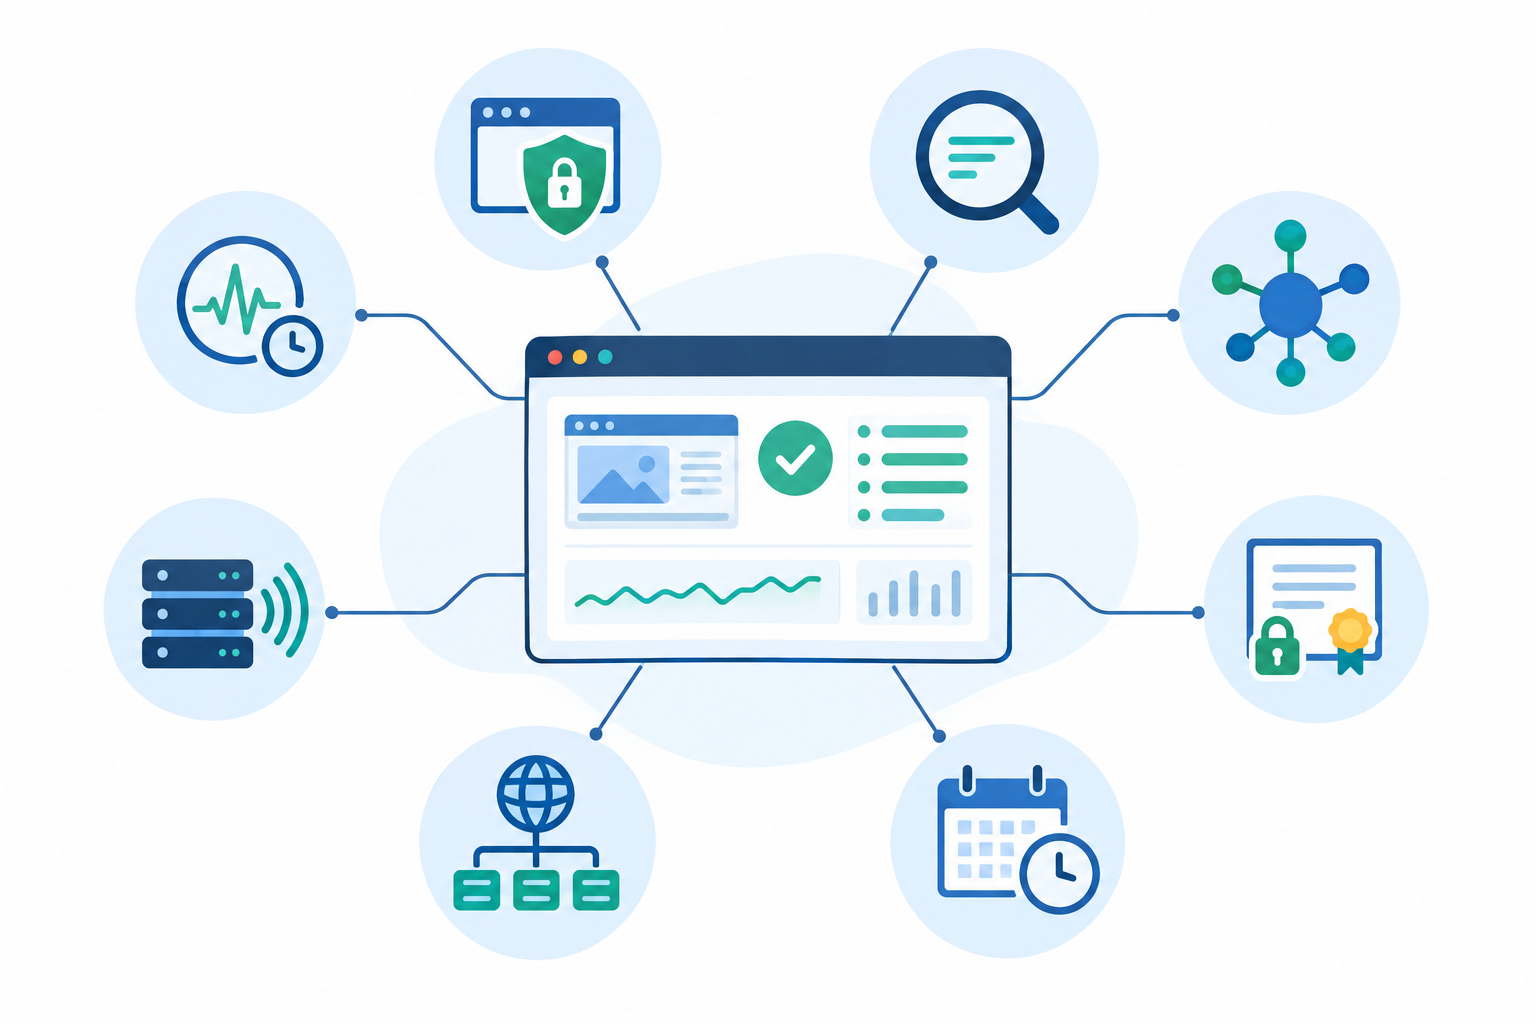
- HTTP/S website monitoring. Check the homepage, plus business-critical pages such as checkout, booking and contact forms. A homepage that loads tells you nothing about whether people can actually book.
- Keyword monitoring. Some of the nastiest failures return a perfectly healthy 200 status. The page loads, but it shows a database error, a hacked defacement or a blank template. A keyword check looks for text that should be there (or shouldn't be) and catches these.
- API monitoring. Client integrations, headless front ends, payment webhooks and mobile app back ends all count. If an app talks to an API you built, that API deserves its own monitor.
- SSL certificate monitoring and domain expiration alerts. These are classic agency embarrassments, especially when the client owns their own domain and registrar login and nobody remembers who's renewing it. An alert weeks ahead turns a crisis into a quick email.
- DNS monitoring. Unexpected record changes can mean hijacking, broken email or a botched migration. Change detection tells you when something moved that shouldn't have.
- Port and ping checks. Useful for servers and hosting you manage directly, where you want to know a service is listening, not just that a page renders.
- Cron job and heartbeat monitoring. Backups, scheduled imports, invoice runs and email queues tend to fail silently. With heartbeat monitoring, the job pings Moonitor when it completes, and you get an alert when the ping doesn't arrive.
A quick reassurance: a five-page brochure site doesn't need all of this. Website, SSL and domain checks cover most of the risk. Add the rest when the site's importance or complexity justifies it.
How many monitors will your agency need?
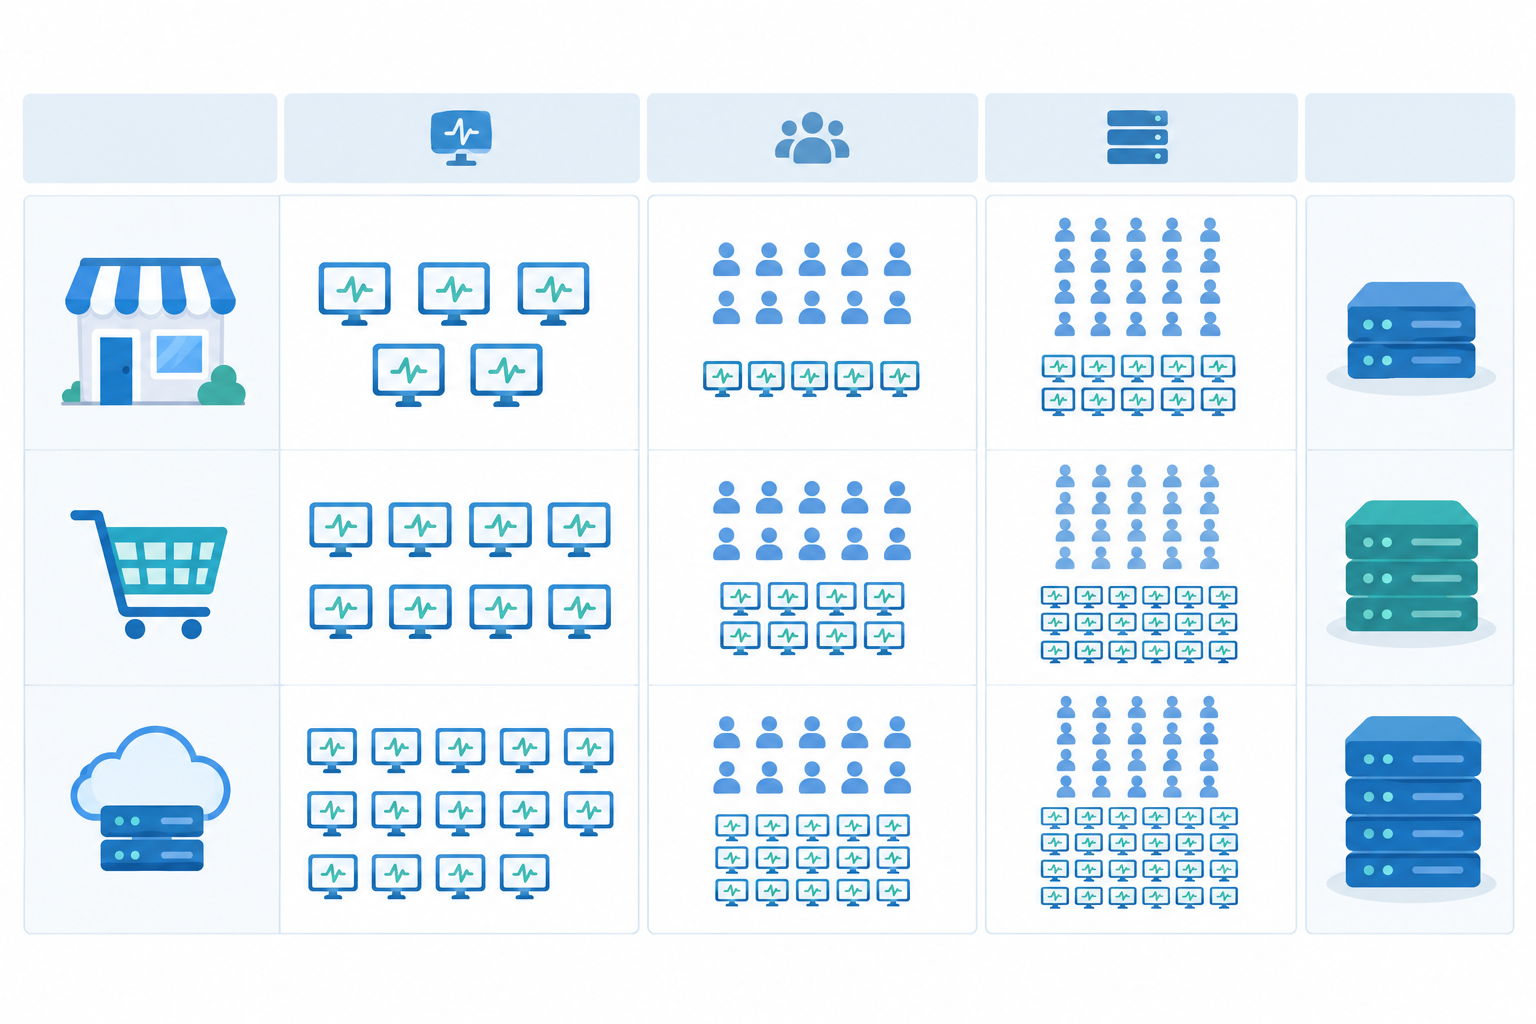
There's no universal number, and Google's SRE guidance backs that up: count the distinct things whose failure would need a different response. A handy test for each proposed monitor is, "What would we do if this check failed?" If two checks trigger the same action and measure the same failure, one is probably redundant. If they'd go to different owners or need different fixes, keep them separate.
Here's a rough sizing guide.
| Client type | Typical monitors | What they usually cover |
|---|---|---|
| Brochure site | 3 to 4 | Website, SSL, domain, maybe a keyword check |
| E-commerce store | 8 to 10 | Storefront, checkout, product API, keyword checks, SSL, domain, DNS, cron jobs |
| SaaS or API-heavy client | 10 to 14 | Several endpoints, app front end, webhooks, SSL, domain, DNS, heartbeats |
These are starting points, not rules. Your clients will vary.
Two worked examples
Ten clients on small sites. Say all ten are brochure sites at three monitors each (website, SSL, domain). That's 30 monitors. Add a few keyword checks and you're nearer 35.
Twenty-five clients with mixed stacks. Suppose 12 brochure sites at 3 monitors (36), 8 e-commerce stores at 8 (64), and 5 API-heavy clients at 12 (60). That's roughly 160 monitors, and the number will climb as soon as you add staging environments or a second check per site.
Choosing a monitoring plan
Moonitor's Solo plan is $14 a month for 20 monitors, which fits a pilot or a small portfolio comfortably. At the other end, the Max plan is $49 a month with unlimited monitors. Pricing is in US dollars, so UK agencies should factor in the exchange rate when budgeting.
Unlimited makes sense when:
- your client list is growing and you'd rather not count monitors every time you win a project
- you want staging and pre-production environments covered
- you want multiple checks per site, like separate checkout, API and keyword monitors
If you're not sure, the 7-day free trial needs no credit card, so you can pilot with two or three clients before you commit to anything.
How to respond before the client notices
Website uptime monitoring only helps if the right person sees the right alert at the right time. Here's a response workflow that works for small teams.
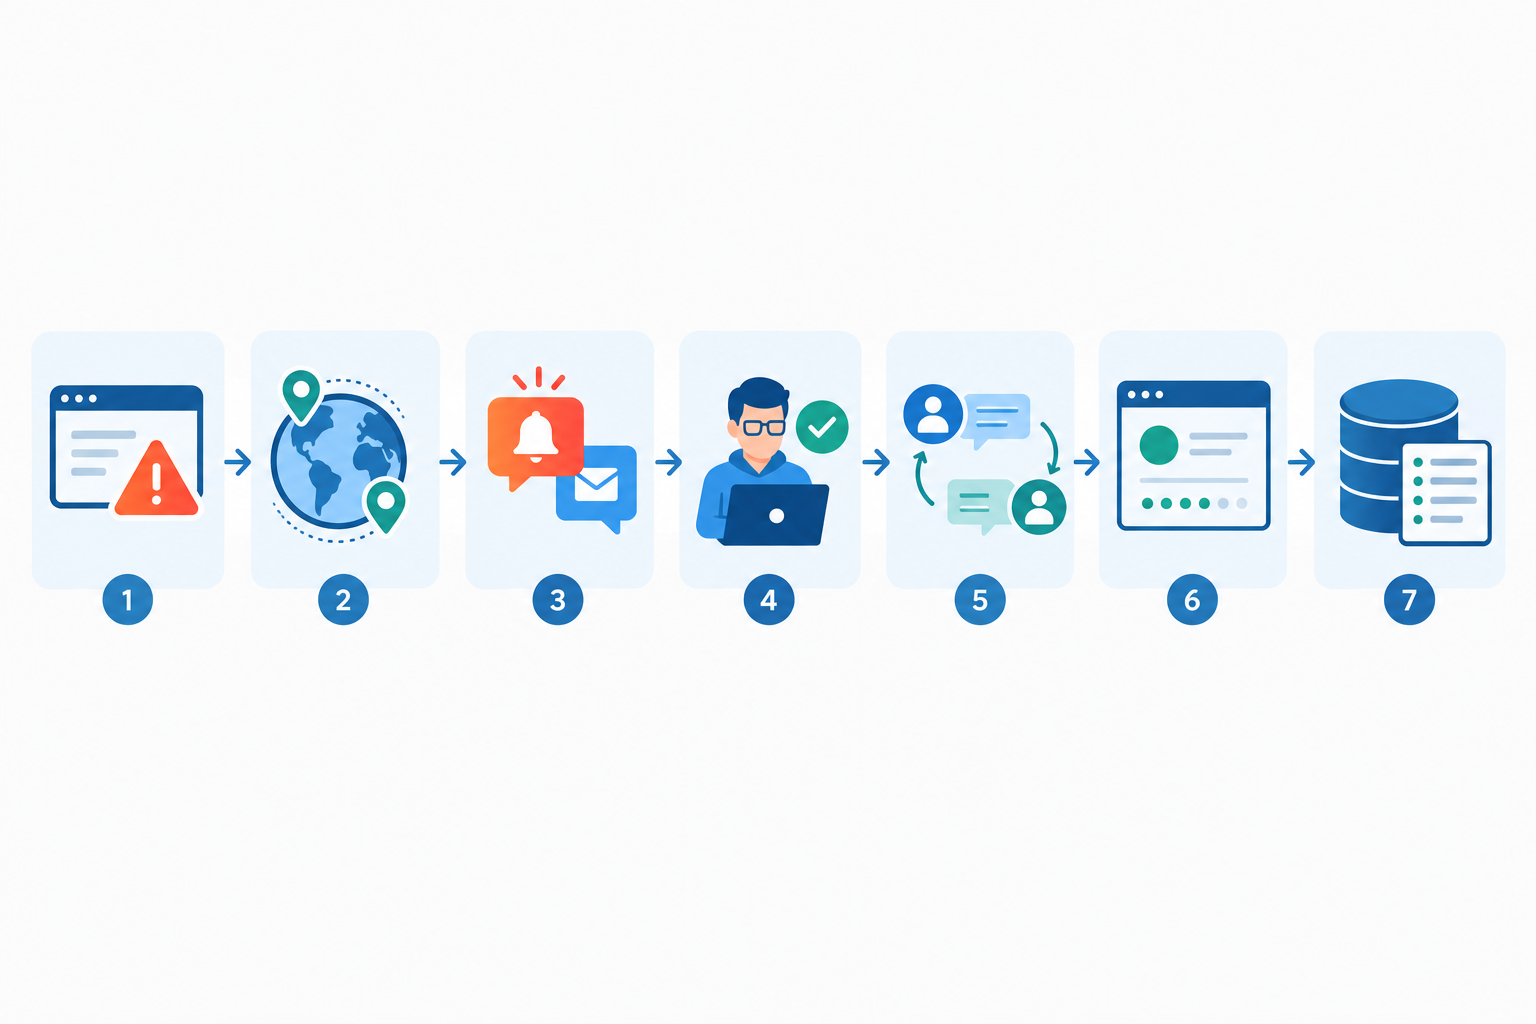
- Route alerts to where your team already works. Moonitor sends incident alerts by email, Slack, Discord, Telegram and webhooks, so you can pipe them into your ticketing system too. If alerts land somewhere nobody looks, they might as well not exist.
- Verify failures from multiple regions. With multi-region failure verification, a blip in one location doesn't wake someone at 2am for a false alarm. Only confirmed failures reach your team.
- Decide who owns each client's alerts. Settle in advance who's on point, who's the backup, and what the out-of-hours path looks like. Unowned alerts quietly become ignored alerts.
- Agree severity levels and response targets. Keep them realistic. A two-person agency promising a 15-minute response at midnight is setting itself up to fail. A brochure site down overnight might be a first-thing-morning job. A checkout outage might not.
- Message the client early. Short and calm wins: "We've spotted an issue with your site at 06:34. We're investigating and will update you by 07:00." Ideally this lands before they ask.
- Use a branded public status page when the audience is bigger. If a client's customers or members are likely to wonder whether the site is down, a status page lets them check for themselves. That means fewer support emails for everyone.
- Log what happened. Record the cause and the fix in the incident history. You'll thank yourself at reporting time.
How to reduce alert fatigue
I'll be honest: this is where a lot of monitoring setups quietly die. Monitor thirty clients with noisy checks and you'll be muting channels within a fortnight. Then the real alert arrives and nobody sees it.
Low-noise monitoring is what keeps a team paying attention. Multi-region verification helps, but so does being selective. Monitor what matters, route alerts to named people, and prune checks that no longer earn their place.
Using response-time data in client reports
This is where monitoring turns into something clients can actually see. A good client report is short, readable and focused on decisions.
What monitoring data should you share with clients?
- uptime percentage for the period
- number and length of incidents
- response-time trends
- SSL and domain renewal status
- cron job and backup health
One tip from SRE practice: a headline uptime figure on its own can mislead. Agree with each client what counts as downtime, which exclusions apply (planned maintenance, for instance), and the reporting period, so the number means the same thing to both of you.
What to leave out of client reports
Raw alert noise, internal chatter and technical detail that doesn't help the client decide anything. They don't need to know which probe location flickered. They need to know the site was healthy, or what you did when it wasn't.
How to prove value when nothing breaks
This is the big one. A clean month isn't an absence of work. Show the evidence:
- checks run across the month
- issues caught early, before they became outages
- certificates and domains renewed in time
- stable response times
A clean incident history is proof of good maintenance, so present it that way.
Turn response times into recommendations
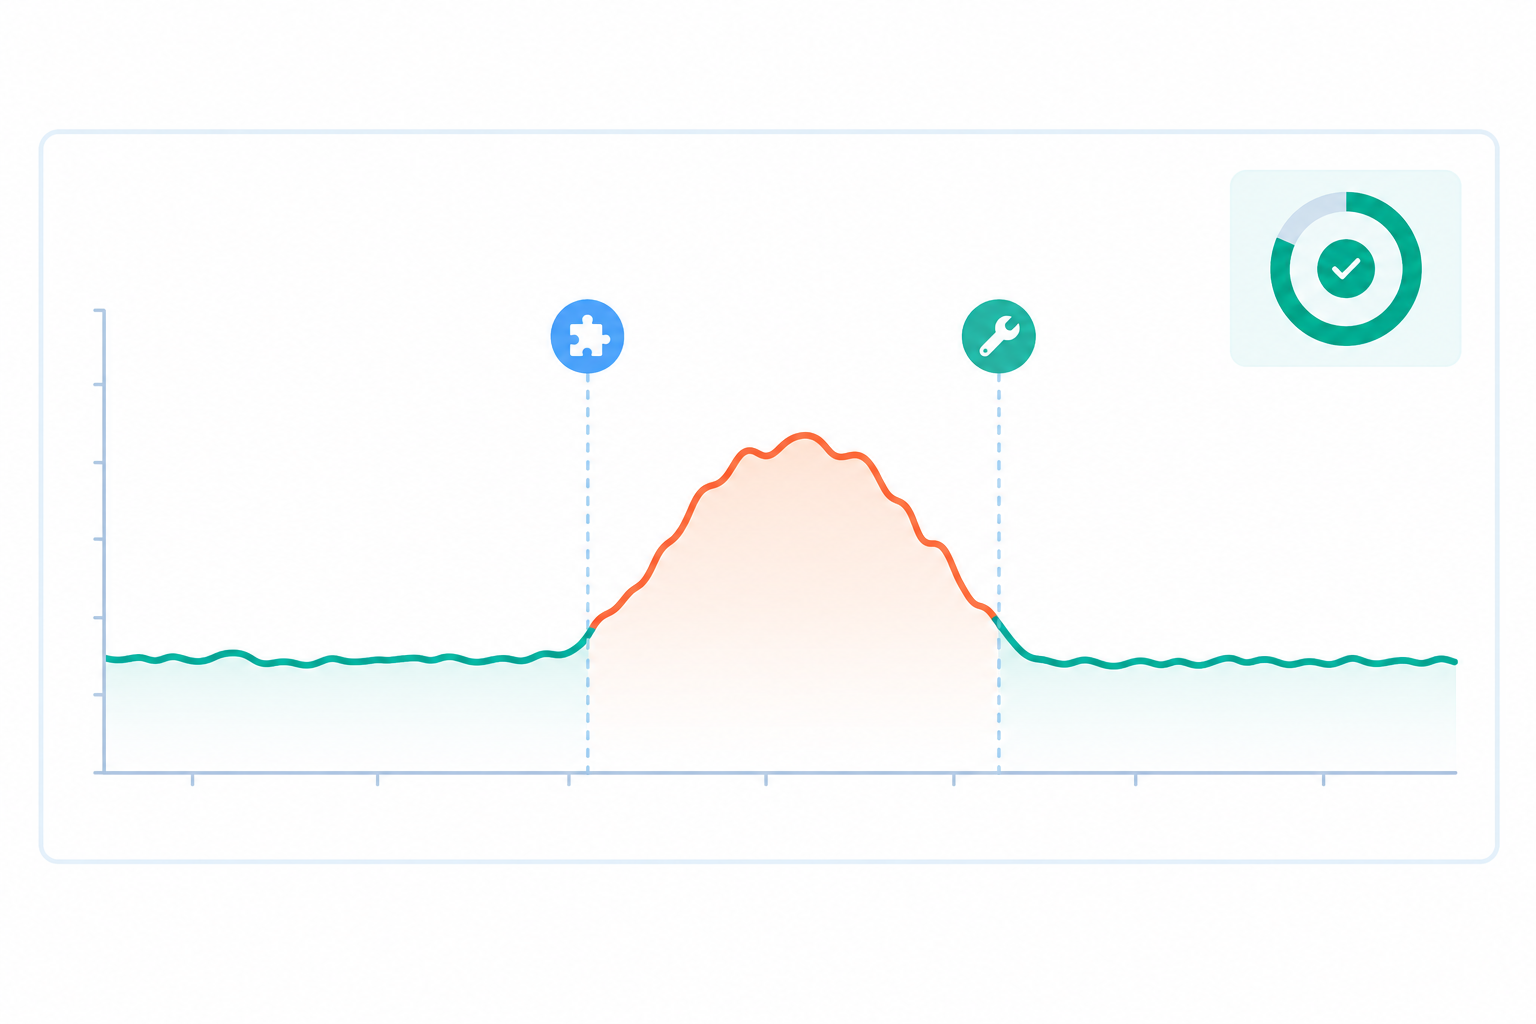
Response-time analytics are brilliant for spotting slow creep. Maybe a plugin update added 400ms, a new tracking script bloated the homepage, or a traffic spike exposed a hosting limit. Catch it early and you can say, "Here's what's happening, and here's what we'd recommend." That's a conversation that leads to extra work, in a good way.
Incident history tells stories, too. "We detected the issue at 14:02, identified a failed deployment and rolled it back by 14:14. Response times returned to normal immediately." Twelve minutes, with before-and-after timings. That's far more convincing than "we fixed it".
A simple client reporting rhythm
Monthly works for e-commerce and busy sites. Quarterly is usually enough for brochure sites. Keep it to one page: headline numbers, notable incidents, upcoming renewals, one recommendation. If it's eating billable time, it's too long. Moonitor's API and data export let you pull the numbers into your own reporting tools, so you're never locked into a single format.
Pricing website monitoring into agency retainers
Yes, you can include monitoring in your retainers, and plenty of agencies do. The real question is how.
Three common approaches
- Bundled into existing maintenance. Simplest to sell, and it quietly raises the perceived value of what you already offer.
- Tiered packages. Basic, standard and premium, with monitoring depth increasing at each level.
- A separate line item. Transparent, but it can invite price comparison with DIY tools.
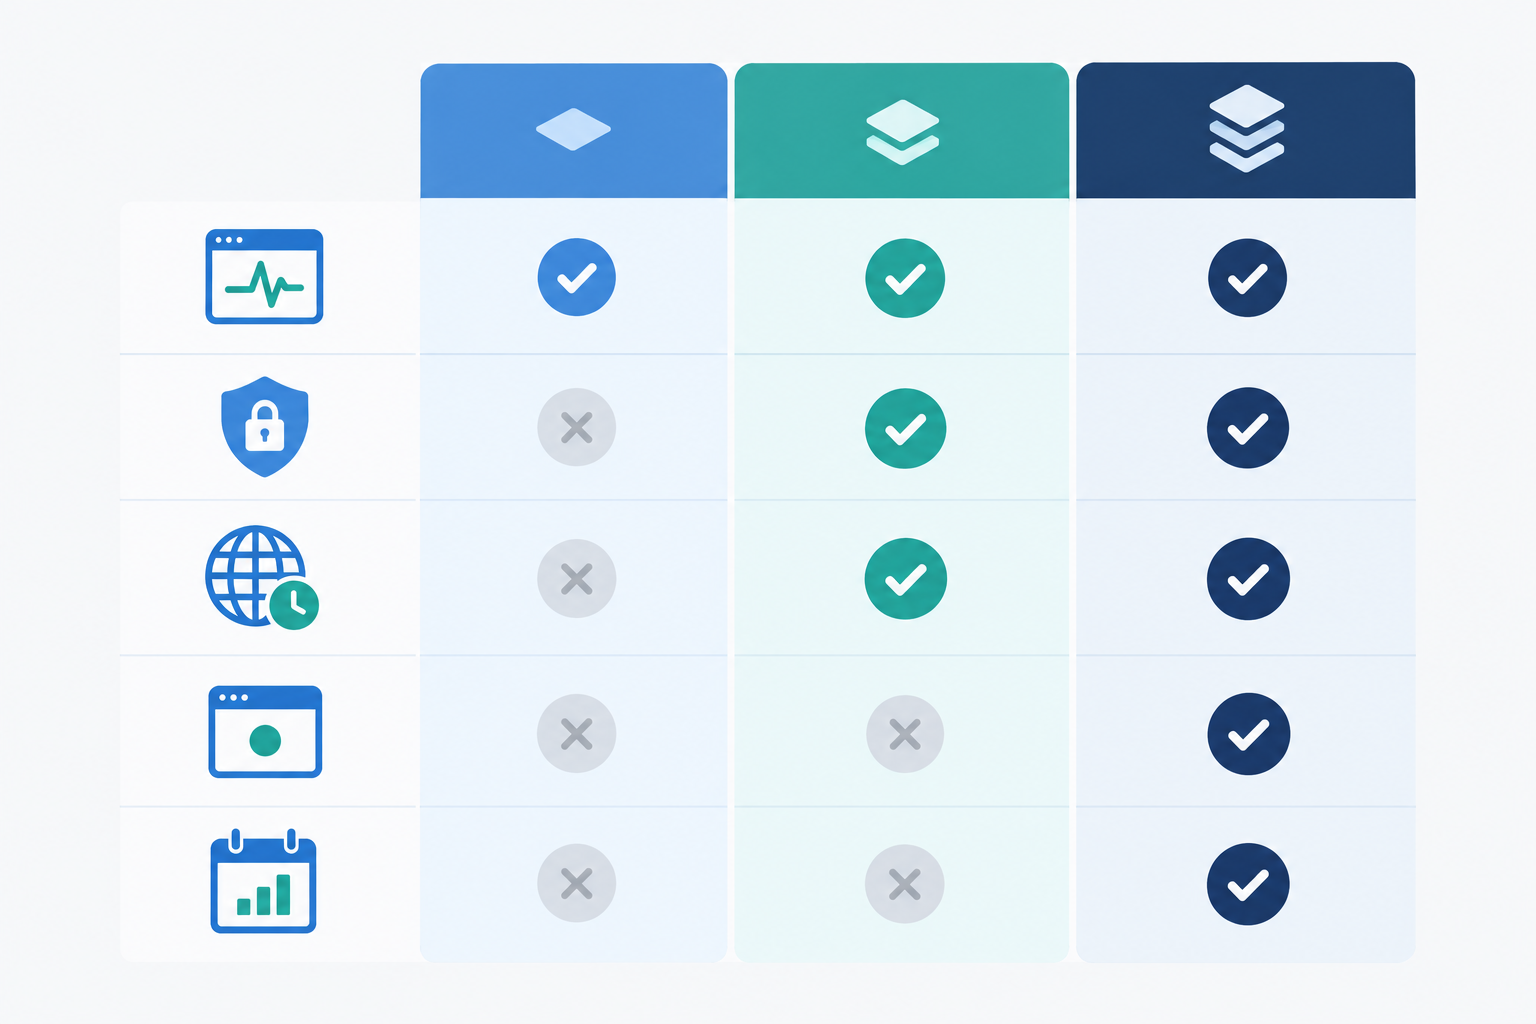
A tiered structure might look like this:
- Essential: website, SSL and domain monitoring with alerts to your team and a quarterly summary.
- Standard: adds keyword, API and heartbeat checks plus monthly reporting.
- Premium: adds a branded status page, escalation contacts, defined response coverage and a regular service review.
This is a packaging example, not a market standard, so adjust it to your clients.
Separate detection from repair
Here's one of the cleanest lessons: monitoring and alerting is one thing, and investigation, after-hours response and fixes are another. Monitoring can be a defined recurring service, while diagnosis and remediation sit in a higher tier or are billed separately. That stops you from implying a monitoring subscription includes unlimited maintenance.
The margin maths
Here's an illustration. On Moonitor's Max plan at $49 a month, spread across 25 clients, the tooling cost is about $2 per client per month. Across 10 clients it's under $5. Even allowing for your own setup, admin and reporting time, set that against a maintenance retainer that might run to a few hundred pounds a month and the margin is clear. Check current pricing before you quote, as plans can change.
Frame monitoring by client outcomes
Clients don't buy tooling. They buy faster response, fewer surprises and reportable uptime. Lead with those.
Be careful with uptime promises
Don't guarantee 100% uptime. Even the major cloud providers publish SLAs with specific limits and exclusions. For context, 99.9% availability still allows about 8 hours and 46 minutes of downtime a year, while 99.99% allows about 53 minutes. Be clear about what's under your control (monitoring, alerting, your response) and what belongs to the host, the payment provider or the registrar.
UK considerations for agency pricing
- Quote in GBP, and be upfront if you're absorbing exchange-rate movement on a USD-priced tool.
- Be clear on VAT treatment in your proposal, particularly if monitoring is a separate line item.
- Put the scope, exclusions and response expectations in your service agreement or SLA in plain English.
Sample wording for a monitoring retainer
Proactive uptime monitoring. We monitor your website, SSL certificate and domain around the clock from multiple locations. If we detect a confirmed issue, our team is alerted immediately and we'll keep you informed. You'll receive a monthly report covering uptime, incidents and response times. Monitoring covers the systems we manage; outages at third-party providers are reported but are outside our control.
Simple, honest and outcome-led.
Getting started with agency website uptime monitoring
This doesn't need a project plan. Setup takes under a minute per monitor, so the real effort is deciding what matters, not configuring tools.
- Start with your top three to five clients. Pick the ones most likely to notice an outage and most valuable to keep.
- Add the core monitors. Website, SSL, domain, plus any critical API or cron job.
- Set sensible check intervals and alert channels, then test them once. Trigger a test alert and make sure it reaches the right person.
- Create a status page for clients who want visibility.
- Review the first month's data and share a short summary with the client.
- Roll out to the rest in batches as the process settles in.
Notice what's missing: no migration weekend and no big-bang launch. Keep a simple inventory of each monitor's purpose, owner and alert recipient, and review it when a client's site changes.
Frequently asked questions about uptime monitoring for agencies
Can I include monitoring in my maintenance retainers?
Yes, and many agencies do. You can bundle it into an existing maintenance package, offer it as a tier (for example basic checks versus full monitoring with a status page), or list it as a separate line item. Whichever you pick, describe the outcomes, such as faster response and monthly reporting, rather than the tool itself.
What monitoring data should I share with clients?
Keep it simple: uptime percentage, incidents and how quickly they were resolved, response-time trends, and upcoming SSL or domain expiries. Leave out raw alert noise and technical detail that doesn't help the client understand the health of their site.
How do I prove value when nothing breaks?
Show the work that keeps things quiet. Report on the number of checks run, issues caught before they became outages, certificates and domains renewed on time, and steady response times. A clean incident history is evidence of good maintenance, not an absence of it.
How many monitors will I need for my client portfolio?
As a rough guide, a brochure site might need two to four monitors (website, SSL, domain, perhaps a keyword check), while an e-commerce or API-driven client could need eight or more once you add checkout pages, APIs, DNS and cron jobs. Multiply by your client count to pick a plan, and choose an unlimited plan if you expect to grow.
Will I get flooded with false alarms across all my clients?
Not if your monitoring verifies failures from multiple regions before alerting. That filters out one-off network blips, so your team only hears about real incidents. It matters a lot when you're watching dozens of sites.
Your next step
You don't need to monitor everything on day one. Pick two or three clients, add the essentials, and see what the data tells you after a month. With Moonitor's 7-day free trial (no credit card required), you can have those first monitors, alerts and a status page running this afternoon. Your next client conversation might then start with "here's what we caught for you" instead of "sorry, we missed that". 🌙