
How to Monitor Multiple Client Websites From One Dashboard: An Agency Playbook
Learn how agencies can monitor multiple websites with a central uptime dashboard, client-specific alerts, multi-region checks and branded status pages.

The best way to monitor multiple websites as an agency is to put every client site, API, and scheduled job into one uptime monitoring dashboard, name each monitor consistently by client, and send each client's alerts to the person who owns that account. Add multi-region failure verification to cut false alarms, and give clients branded status pages so they can see their own uptime. Do that and you'll hear about problems before your clients do, which means you get to reach out first. 🙂
That's the short version. Below is the longer, practical one: how to set it up, who should get which alert, what to say when something breaks, and how to keep it manageable as your client list grows.
Why agencies need centralised uptime monitoring to manage multiple websites
Picture Monday, 8:47am. You've barely sat down with your coffee when an email lands: 'Hi, our site's been down since Friday afternoon. Did you know?' Your stomach drops. You didn't know. Nobody did. A client's checkout was broken all weekend, and you found out from the one person you least wanted to hear it from.
I've heard versions of this story from nearly every agency owner I've talked to. The outage itself is rarely the real damage. Sites go down, and clients mostly understand that. What hurts is finding out from the client. It plants a small doubt about whether you're really looking after them, and that doubt shows up later in retainer reviews and SLA conversations.
The hidden cost of scattered monitoring tools
Here's how it usually happens. One developer set up a free monitor for the first client years ago. Another used a different tool for the e-commerce build. Someone else relies on the host's built-in alerts, which go to an inbox nobody checks. You end up with:
- Separate logins for everything, so nobody has the full picture
- Uneven coverage, with some clients monitored heavily and others not at all
- Alerts that land with 'whoever's around', which in practice means nobody
- No single place to look back and ask 'how many times has this site gone down this year?'
Google's Site Reliability Engineering guidance makes a related point: a centralised view lets you compare availability, response times, and errors across sites, and makes it easier to spot shared incidents or recurring problems. It's an operational control, not a magic fix. A dashboard helps you detect problems and coordinate, but you still need people and a process to act.
Shared incidents deserve a closer look. When Fastly had its widespread outage in June 2021, one provider problem hit many sites at once. If your monitors live in one place, you can watch five client sites turn red together and think 'that smells like a shared provider' instead of chasing five unrelated bugs.
What uptime monitoring for agencies gives you
In plain terms, you get three things:
- One view of health: every client, every environment, at a glance.
- One alerting policy: the same rules, applied the same way, with a clear owner.
- One incident history: a record you can use in monthly reviews and renewal chats.
The stakes aren't trivial, either. Uptime Institute's 2024 survey found that 54% of respondents said their most recent significant IT outage cost more than US$100,000. That's about IT outages generally, not agency-run brochure sites, but it's a useful reminder that clients take downtime seriously and you should too.
In this guide we'll cover naming, alert routing, wider coverage (SSL, domains, APIs, cron jobs), status pages, and scaling. I'll use Moonitor as the worked example, since it's built for exactly this kind of single-dashboard setup.
How to structure monitors for each client
A dashboard with 80 monitors is only useful if you can find the right one at 2am. Structure is what makes that possible. Here's the process I'd follow.
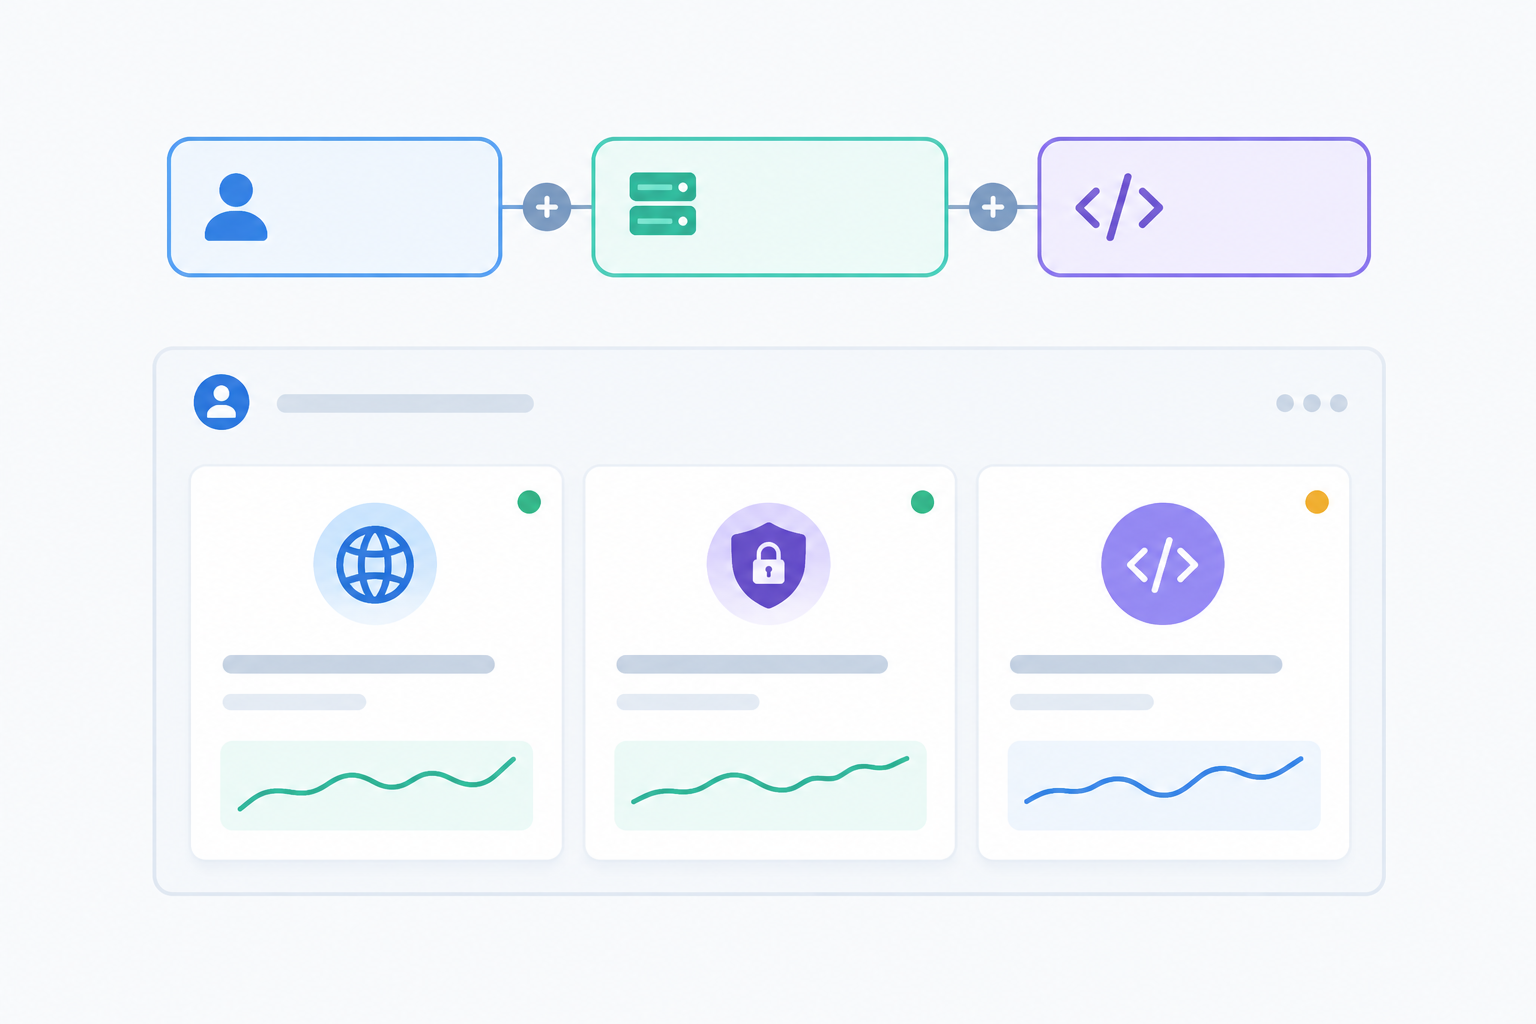
Step 1: Audit every client asset first
Before you add anything, list what each client actually has. Not just the main website. Think about:
- Live sites and staging sites
- APIs and third-party integrations
- Servers or VPS instances you manage
- Cron jobs, such as backups, order syncs, and scheduled emails
- Domains and SSL certificates
This audit is usually humbling. Almost every agency finds at least one forgotten domain or a backup script nobody has verified in months.
Step 2: Pick a naming convention and stick to it
My favourite pattern is Client – Environment – Type, for example:
- Harlow Bakery – Prod – HTTPS
- Harlow Bakery – Prod – SSL
- Harlow Bakery – Prod – Orders API
It looks fussy until you're searching for 'Harlow' during an incident and everything related to them appears together. It also makes reporting far easier later, because you can pull every monitor for one client without guessing.
Step 3: Decide what 'up' really means
A site can return a perfectly healthy 200 response and still be broken. A plain HTTP/S check only tells you the server answered. A keyword monitor tells you the page actually contains what it should, like a product name, an 'Add to basket' button, or your footer text. That catches the nasty cases: a page that loads but shows an error message, a blank template, or a defaced 'hacked' notice.
Google's SRE guidance makes the same point: uptime checks alone can miss problems users actually see. For important pages, pair a basic availability check with a keyword check.
Step 4: Choose check intervals by client tier
Not every site needs the same attention. An e-commerce client losing sales by the minute deserves frequent checks. A five-page brochure site for a local plumber can be checked less often. Define two or three tiers (say, Critical, Standard, Light) and apply them consistently. It keeps alert noise down, too.
Step 5: Write a one-page onboarding checklist
Put the whole setup on one page: which monitors to create, the naming pattern, the interval for each tier, and who owns the alerts. In Moonitor, adding a monitor takes under a minute, so a new client's full set takes a few minutes and looks the same every time.
A practical tip: add monitors at client onboarding, not after the first outage. Make it part of 'go live', alongside DNS and analytics. 🚀
How to route website monitoring alerts to the right account manager
Alert fatigue is real. When every alert pings every person, everyone quickly learns to ignore the channel. Then the one alert that matters scrolls past unnoticed.
The fix is clear ownership, not fewer monitors.
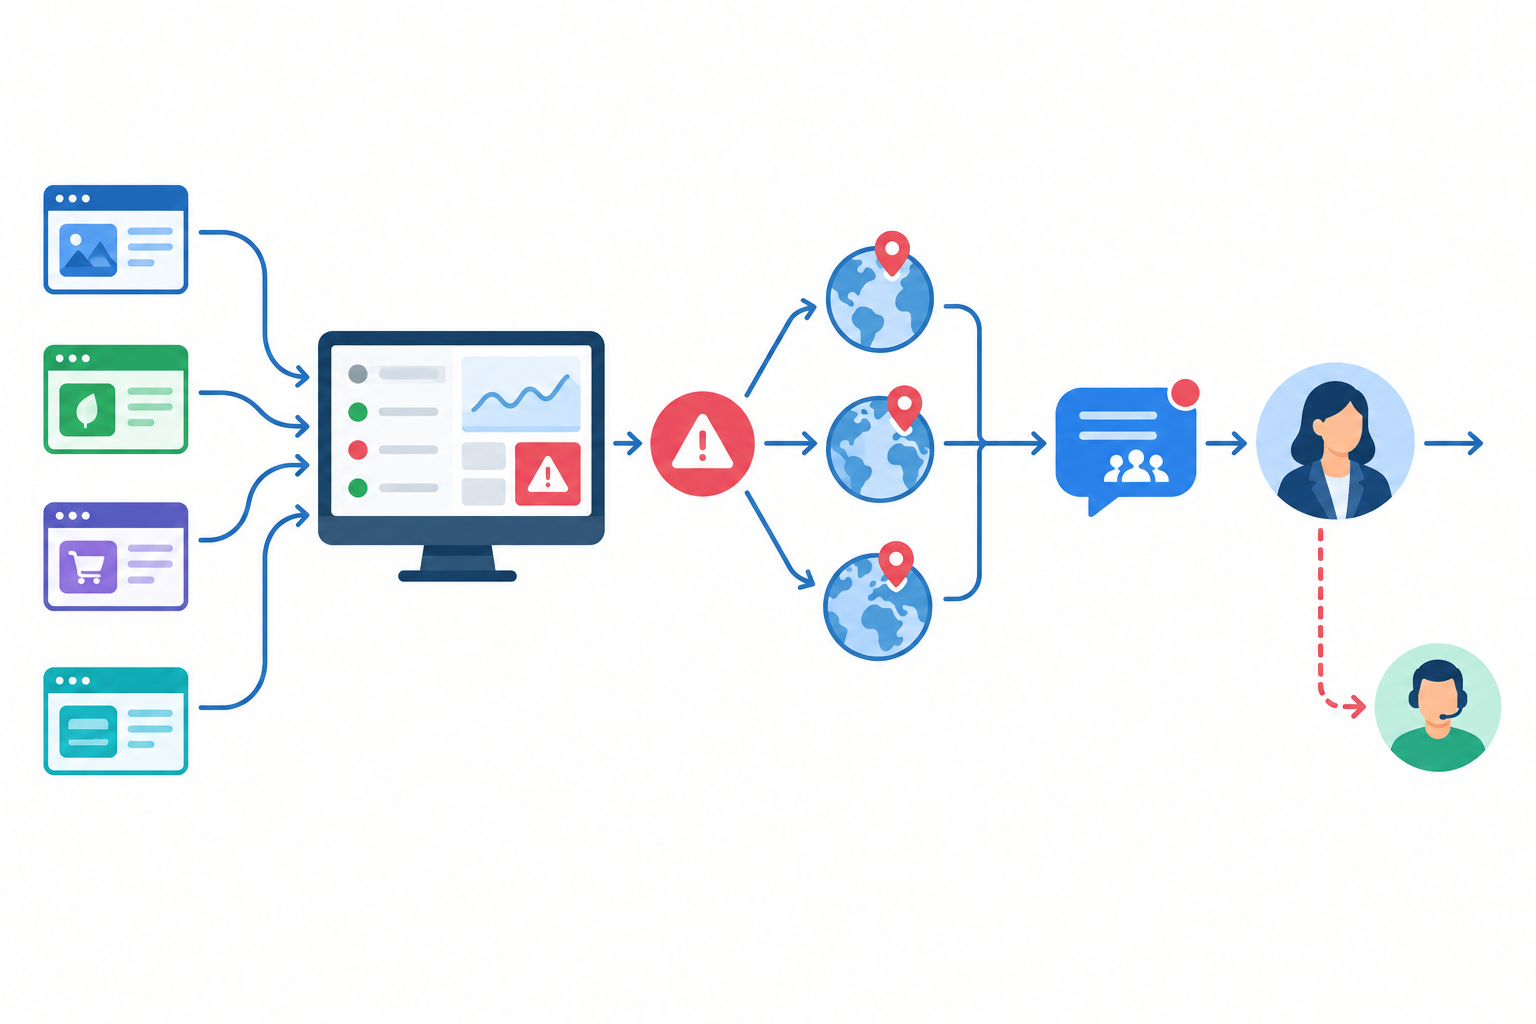
Map each client to an owner
For every client, write down who plays each of these roles:
- Primary contact: the person who gets the alert first
- Backup: who steps in if the primary is out or unreachable
- Escalation path: who gets pulled in if it isn't resolved quickly
This matches sound SRE practice: give each site a client and service owner, define severity and escalation rules, and keep an incident history so alerts never go unowned.
Choose alert channels that fit how your team works
Moonitor can send incident alerts by email, Slack, Discord, Telegram, or webhooks, so you can plug into whatever you already use. A setup that works well for many agencies:
- A dedicated Slack channel per client, or per account manager
- A separate escalation channel for your most critical clients
- Webhooks into your ticketing or on-call tool, so serious incidents create a ticket automatically
Use multi-region verification to reduce false alarms
Nothing erodes trust in alerts like a false alarm. With multi-region failure verification, a monitor only alerts after the failure is confirmed from more than one location. A brief network blip between one probe and your server won't wake anyone at 3am, and when an alert does arrive, you can trust it.
How do you avoid being flooded with monitoring alerts?
- Use sensible intervals by client tier, as above
- Group non-critical sites together so they don't compete with production alerts
- Separate 'wake me up' alerts from 'look at it tomorrow' alerts, like production checkout versus a staging site or a certificate expiring in 30 days
- Review the routing each quarter, because people change roles
Google's SRE Workbook says alerts work best when they're actionable and tied to a problem users can see. If an alert doesn't need anyone to do anything, it probably belongs in a daily digest, not on someone's phone.
Be honest about out-of-hours cover
For UK agencies, this is mostly about expectations. Check what your contracts actually promise. If a client's agreement says 'business hours support, 9 to 5:30', then a 'wake me up' alert at 2am for their brochure site is probably overkill. If you've promised a 24/7 response for an e-commerce client, someone needs to be on call, and everyone needs to know who. Write it down, so nobody is guessing at 11pm on a Saturday.
What to do when a client website goes down: proactive outreach
This is where monitoring turns into reputation. The aim is simple: the client hears it from you first, with a plan attached.
Step 1: Acknowledge and claim ownership
The first person to see the alert says so in the team channel: 'I've got Harlow Bakery.' That one line stops three people investigating the same thing, or worse, nobody investigating at all.
Step 2: Check the details
Look at the incident details and response-time analytics. When did it start? Was response time creeping up beforehand? Does it look like a hosting problem, a DNS issue, or an application error? If several clients on the same host are failing, you're probably looking at a provider incident rather than a code problem. Moonitor's DNS record change detection can also show quickly whether something changed upstream.
Step 3: Message the client before they notice
Keep it short, calm, and plain. Here's a template you can copy:
Subject: We're aware of an issue with your website
Hi [Name],
Our monitoring picked up that [your website / your booking form] isn't loading properly as of [time]. We're looking into it now and think it's [hosting / a recent update / not yet clear].
I'll update you by [time], or sooner if it's fixed. You don't need to do anything for now.
[Your name]
The message does three things: it says what we've seen, what we're doing, and when you'll hear from us next. That's all it needs.
Step 4: Resolve, log, and summarise
Once it's fixed, close the incident and send a brief summary: what happened, how long it lasted, and what you've done to prevent a repeat. Two or three sentences is plenty.
Step 5: Review incident history monthly
Once a month, scan the incident history for repeat offenders. A site that goes down every few weeks is telling you something. Maybe it needs better hosting, a caching fix, or a plugin clean-up. You can start that conversation with evidence instead of guesswork.
And here's the mindset shift I'd encourage: an outage handled well is a chance to show your value, not just a problem to hide. Clients rarely remember that a site went down for 20 minutes. They remember that you told them before they asked. 💬
How to monitor SSL, domains, APIs, servers, and cron jobs
Website monitoring is only the start. The incidents that really embarrass agencies are often the boring ones: an expired certificate, a lapsed domain, a backup that quietly stopped running. Moonitor offers eight monitor types in one dashboard, so you can cover the whole footprint without juggling tools.
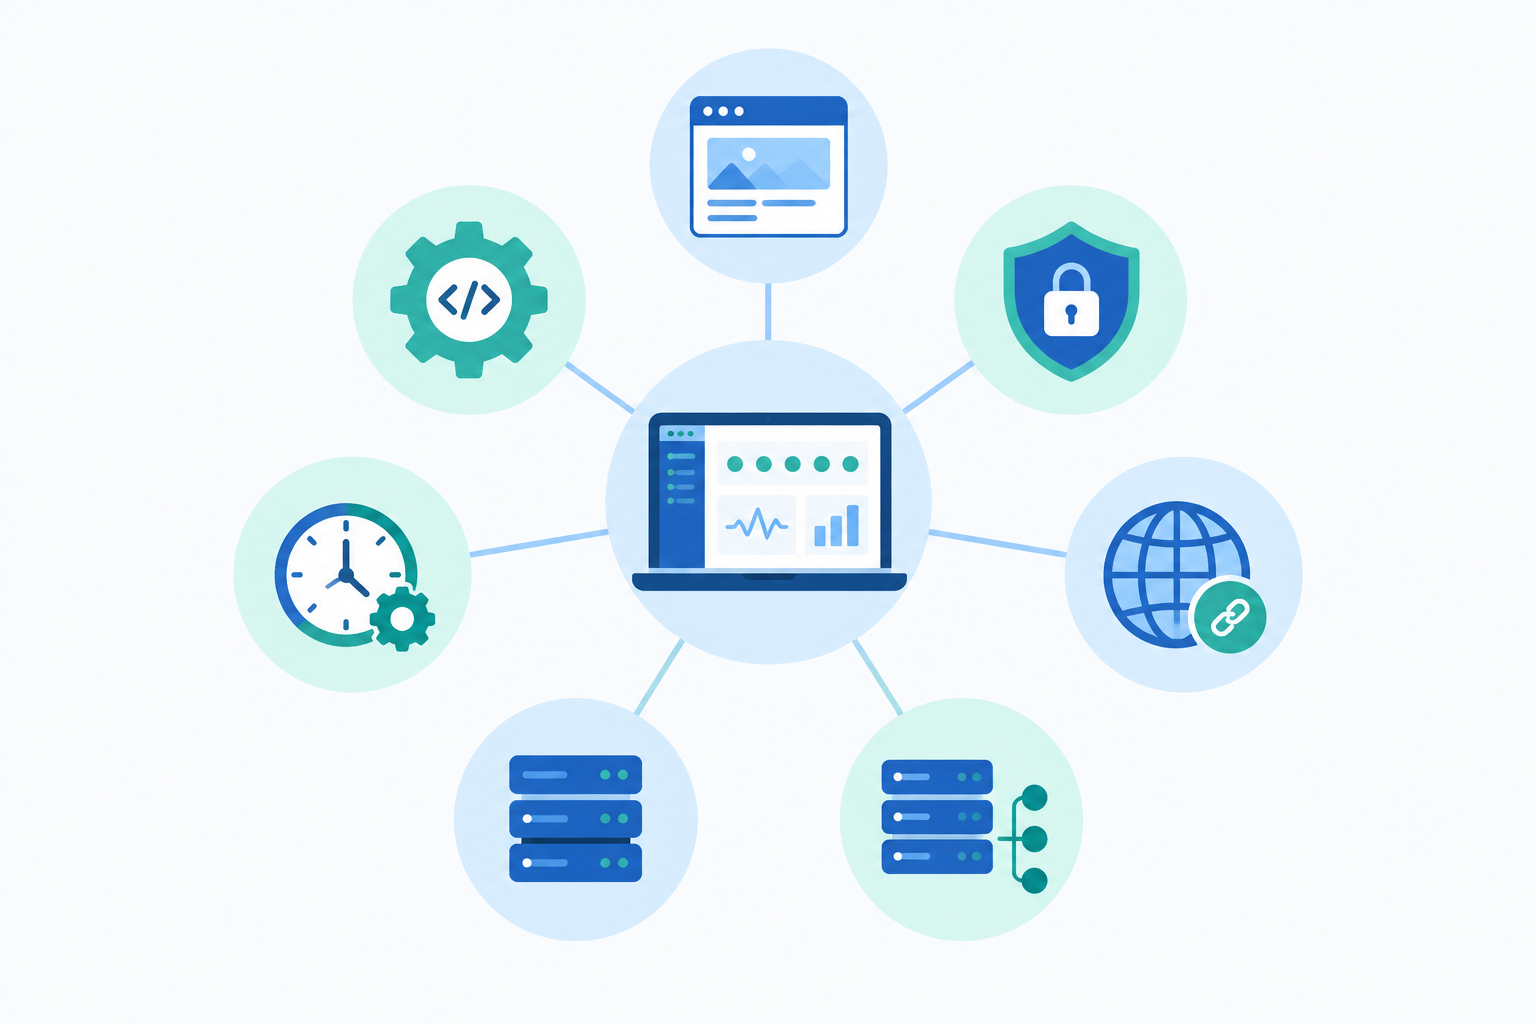
- SSL certificate monitoring and domain expiration alerts: Renewal reminders can land in an inbox nobody reads, especially when the client registered the domain themselves years ago. Monitoring catches renewals weeks ahead. A browser warning that says 'Your connection is not private' will make a client panic far more than a short outage.
- API monitoring: If you've built headless sites, booking systems, payment integrations, or mobile app backends, the front page can look fine while the API behind it is failing. Monitor the endpoints that matter, not just the homepage.
- Cron job and heartbeat monitoring: Backups, scheduled emails, and order syncs fail silently. With heartbeat monitoring, your job pings Moonitor when it runs, and you're alerted if the ping doesn't arrive. We've seen agencies discover a backup hadn't run for six weeks, and only because the check was missing, not because anything told them.
- Server and port monitoring: For self-managed hosting or client VPS setups, check that key ports (web, database, mail) are actually answering.
- DNS monitoring: Detecting unexpected record changes can flag a misconfiguration, a careless edit by a client's IT contractor, or even tampering. It's a quiet safeguard that pays for itself the first time it fires.
- Ping checks: A simple way to confirm basic reachability of infrastructure.
Google's SRE guidance treats dependencies like DNS and TLS certificates as part of a practical monitoring plan, and I'd agree. Think of each client as a hub with several spokes, and make sure every spoke has a monitor.
Can clients see their own uptime? Use branded status pages
The question I'm asked most often is whether clients can see their own uptime. They can. With branded public status pages, you can give each client a page showing their current status, incident history, and uptime over time.
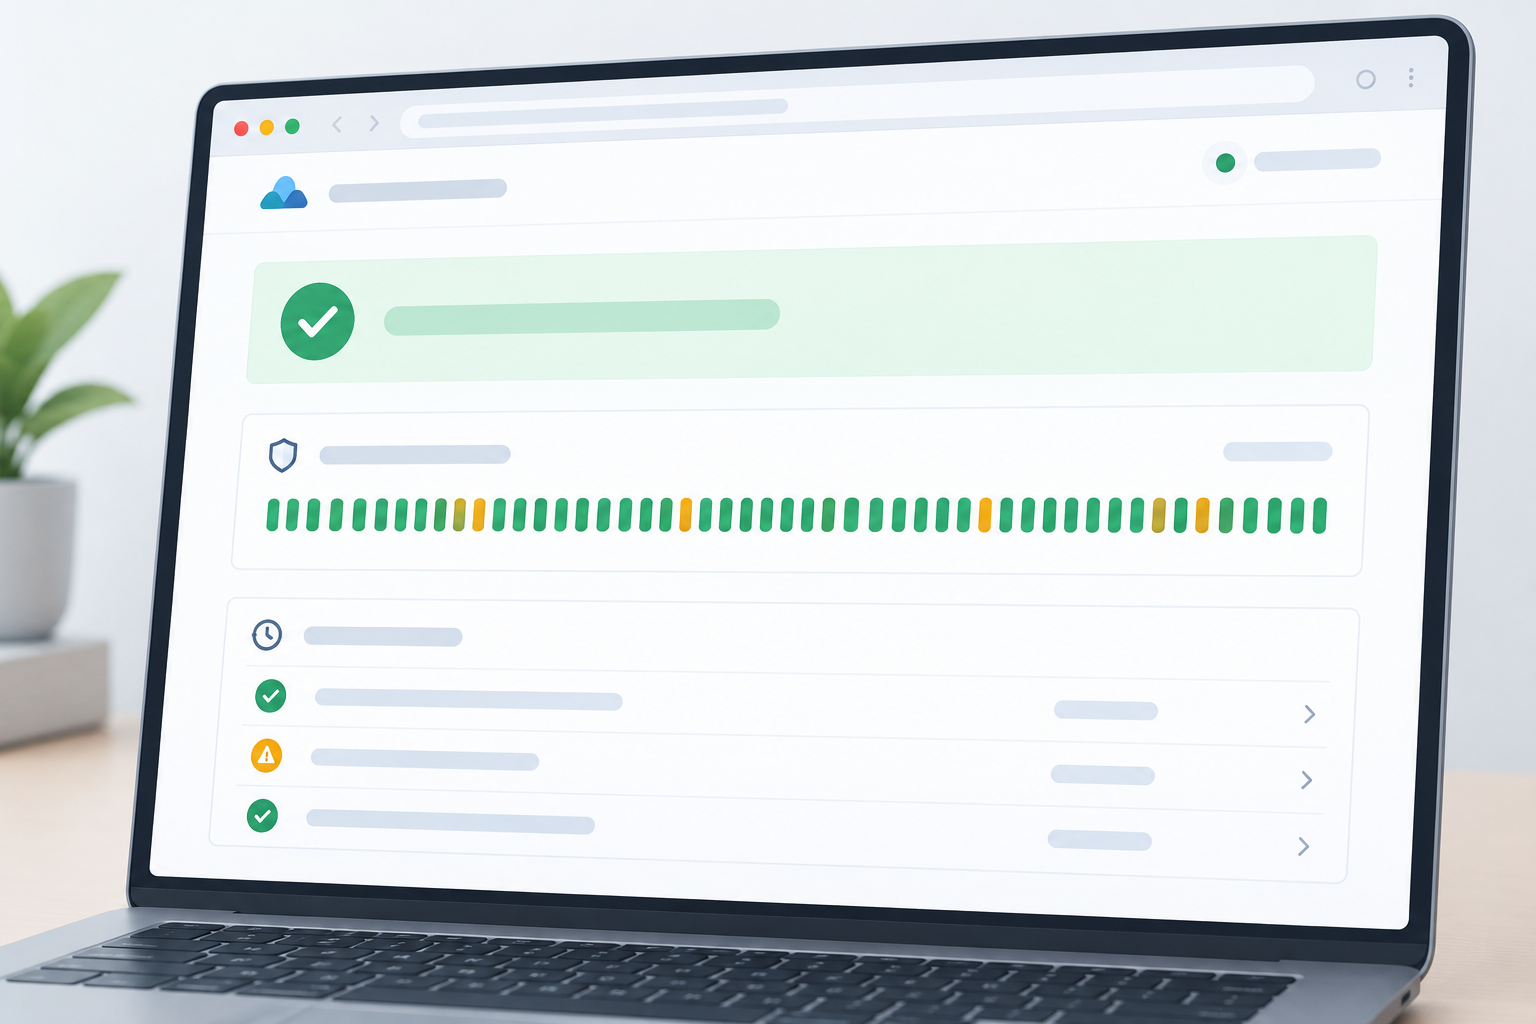
Why client status pages help
A status page cuts down on the 'is the site down?' emails, because clients can check for themselves. It also builds trust. Being open about reliability, including the occasional blip, tends to read as confidence rather than weakness.
How to set up a status page for each client
Create one status page per client, containing only that client's monitors, and use their branding where appropriate. Show the current status, the incident history, and uptime over time.
Think carefully about what to expose. Production website and checkout? Yes. Staging sites, internal APIs, or cron jobs that would only confuse a non-technical reader? Keep those internal. You choose which monitors appear, so the private ones stay private.
Use status pages beyond incidents
Status pages are quietly excellent for sales and retention. Pull one up in a retainer review and you have proof of reliability. Mention it in pitches as part of your care plan. Put simply, it turns invisible work into something clients can see.
Keep status page updates consistent
During an incident, make sure the status page and your direct message say the same thing. If your email says 'we're investigating' and the page still shows green, or the other way round, it creates confusion. Update both at the same time, in the same plain language.
How to scale uptime monitoring as your agency grows
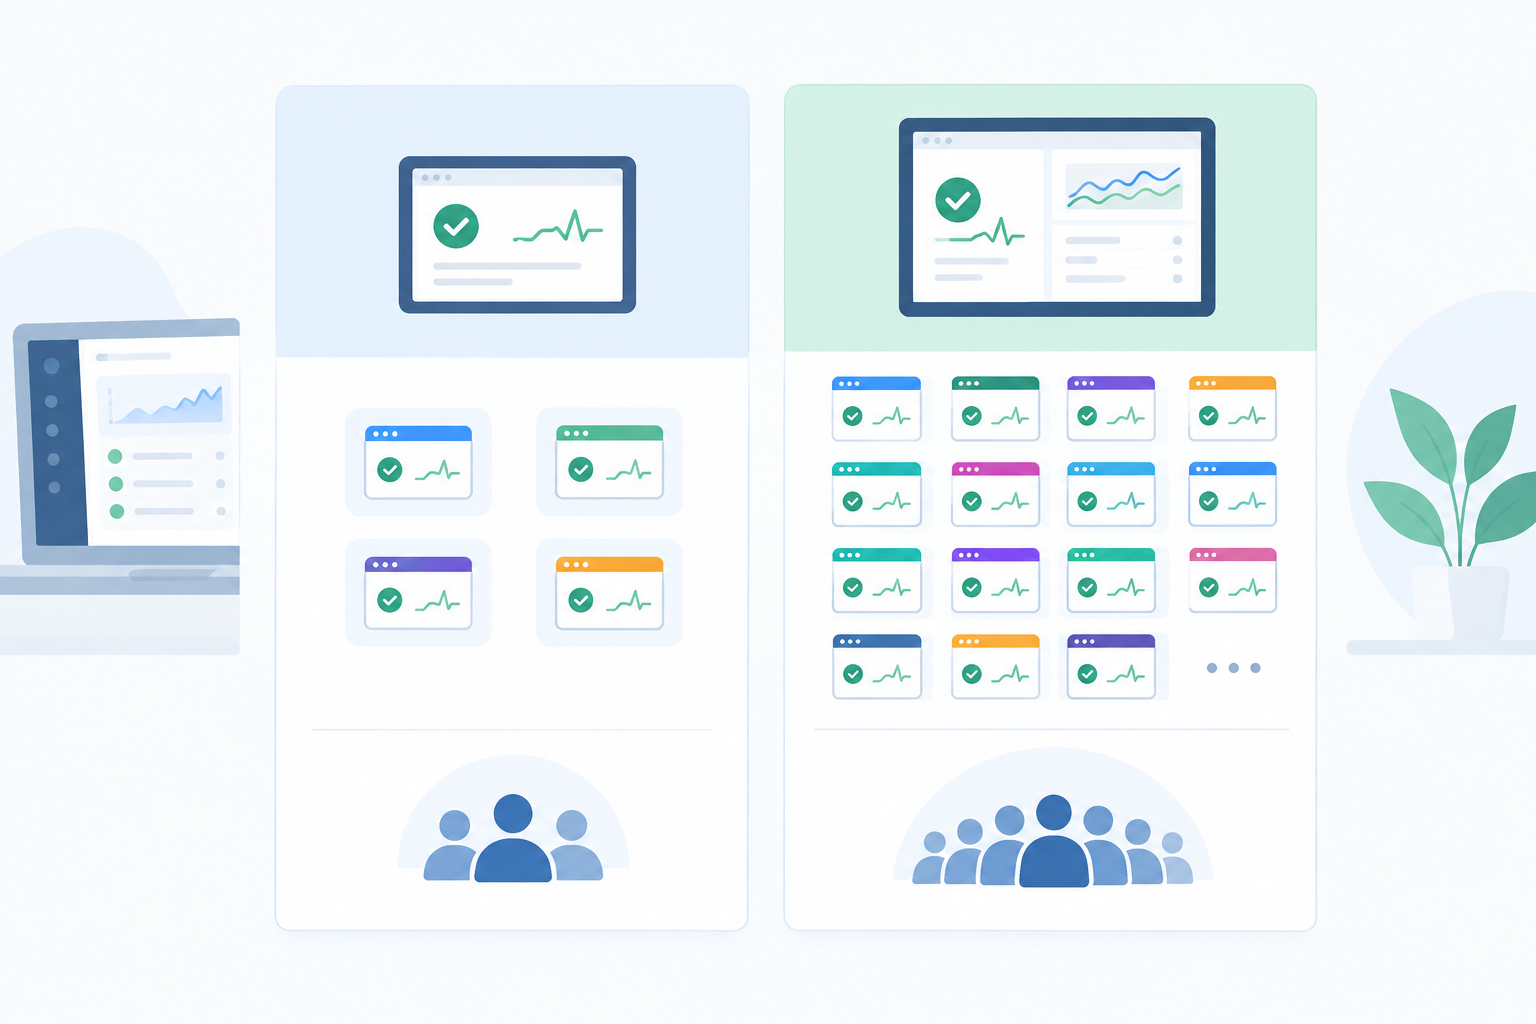
Let's do some rough monitor maths, because it surprises people. A typical client might need a handful of monitors: the site, SSL, domain, an API, maybe a cron job. Google's SRE guidance suggests estimating capacity from checks per client, not just sites. For example, a homepage, checkout flow, and key API endpoint across 40 sites means 120 checks. So 20 clients can quickly turn into 60 to 100 monitors.
| Solo | Max | |
|---|---|---|
| Price | $14/mo | $49/mo |
| Monitors | 20 | Unlimited |
| Best for | Freelancers and very small agencies with a handful of clients | Agencies with many clients or broad coverage (SSL, domains, APIs, cron jobs) |
| Typical client coverage | Roughly 4 to 7 clients with a full set of monitors each | Your whole roster, with room to grow |
The client estimates are rough and depend on how many monitors each client gets. A single brochure site with just an HTTPS check stretches Solo much further than a full-footprint e-commerce client.
Budgeting for monitoring as a UK agency
Moonitor's pricing is listed in US dollars, so factor in the exchange rate and VAT when you budget. The sums are small, but your finance person will thank you for flagging it.
Calculate monitoring cost per client
On the Max plan, if you monitor 25 clients, that's under $2 per client per month. Compare that with what you charge for a care plan or retainer, and monitoring becomes a tiny line item behind a much bigger promise. Many agencies simply build it into the care plan.
Don't judge a monitoring tool only by monitor count
When comparing any monitoring tool, look beyond the monitor limit. Check frequency, locations, alert integrations, reporting, data retention, and API access all matter as your roster grows. Check current limits on each vendor's official plan page, because offerings change. Also think about who needs access to what. Least-privilege thinking, as in NIST's access control guidance, is a sensible principle: give people only the access they need.
A full quota is one sign it's time to move up, but a better one is when client separation, handoffs, reporting, or alert routing start to feel awkward.
Pilot first, avoid lock-in
Use the 7-day free trial (no credit card needed) to try it with a handful of clients before rolling out. Moonitor also has a full API and data export, so you can automate monitor creation as part of your onboarding process and pull uptime data for client reviews, without worrying about vendor lock-in.
A simple quarterly monitoring routine
- Prune old monitors for clients who've left or sites that were retired
- Review alert routing and make sure owners are still correct
- Check coverage for any clients onboarded since last time
It takes an hour, and it stops your setup quietly drifting out of date.
A simple first-week rollout plan for agency monitoring
If this all feels like a lot, start small. Here's a five-day plan:
- Day 1: Start the free trial and add your five most critical clients.
- Day 2: Agree naming and alert routing with your team. Write down owners, backups, and escalation paths.
- Day 3: Add SSL, domain, API, and cron coverage for those clients.
- Day 4: Set up status pages for the clients who'd value them.
- Day 5: Run a mock incident to test your outreach process. Who spots it? Who messages the client? How long did it take?
Then expand gradually, a few clients at a time. You don't need to boil the ocean. A tidy setup for five clients is worth far more than a messy one for fifty.
FAQ: monitoring multiple client websites
How do I keep track of dozens of client websites?
Put every site into one dashboard, use a consistent naming convention such as Client – Environment – Type, and assign each client an owner for alerts. Once the structure is in place, you can scan overall health at a glance and search for any client in seconds.
Can my clients see their own uptime?
Yes. With branded public status pages, you can give each client a page showing their current status, incident history, and uptime. You choose which monitors appear, so internal checks stay private.
How do I avoid being flooded with alerts?
Route alerts per client to the right person or channel rather than to everyone, choose sensible check intervals, and rely on multi-region failure verification so a one-off blip in a single location doesn't trigger a false alarm.
What plan fits an agency?
It depends on how many monitors you need. Small agencies with a handful of clients may fit within the Solo plan at $14/mo for 20 monitors. Agencies with many clients or broad coverage (SSL, domains, APIs, cron jobs) will likely prefer the Max plan at $49/mo with unlimited monitors. The 7-day free trial is a good way to test it.
Should I monitor staging sites as well as live ones?
It's worth monitoring staging for clients with active development or complex integrations, but send those alerts to a lower-priority channel so they don't compete with production issues.
Final thought: monitor multiple websites without losing the personal touch
Good agency monitoring comes down to making sure the right person knows the right thing at the right time, and that your client hears it from you first. Get the structure right, keep the alerts quiet but meaningful, and let clients see the proof. If you'd like to try it, Moonitor's free trial is a low-pressure way to set up your first five clients this week. ☕